Thursday, December 20, 2012

Super Bear


So it's the last week before the holidays and we're in a Grade 8 class hoping to give them something engaging. Dan Meyer's Superbear task came to mind. We also wanted to take advantage of the fact that this class has a set of iPads at their disposal.
But we were also curious: if we showed the students the above video, what sort of questions would come to mind? Well why not use a backchannel to collate these questions? Having recently seen TodaysMeet in action we decided to give this a whirl.
Now I won't lie to you; I was a touch apprehensive about how the students might use (or misuse) this tool. I have seen adults get a bit silly when using it. Royan Lee (who met with our department last week) gave some good advice: Let them use the tool and let them make the mistakes. And when they do make a mistake then it's an opportunity for learning.
I needn't have worried. Yes, there was a lot of "Wassup?" and "Yo, I'm so hungry I wanna eat those bears" comments but nothing harmful. More importantly, there was a lot of really good questions:
We then generalised these into one question:

How many of the regular bears are equivalent to the superbear?
 
We were careful to avoid all reference to any attributes such as mass as we wondered how the students would approach this. Some chose to use volume:
 Some chose to use mass:

Others used the internet to help them get the relevant information:
 A couple of groups even considered calories:
What was neat was that by giving them no information in terms of measurements they had to be very active in thinking what measurements they actually needed. How they then got these and how they then used these was very impressive especially in terms of showing their proportional reasoning.
We watched the Act 3 from Dan Meyer's site and there was some disappointment from some students that their answers differed from his but we emphasised that he was using his bears whilst we were using ours!
Finally we asked the students to reflect on how they approached the problem today:
What probably made this lesson work so well was the lack of information that we gave the students: it forced them to think what question needed to be answered and from there how to answer it.
After all, part of being a good mathematician is not so much answering questions, but asking the questions in the first place.
*          *          *          *
Dan Meyer's Three Act Math can be found here: http://blog.mrmeyer.com/

TodaysMeet can be found here: http://todaysmeet.com/

Monday, December 17, 2012

The Study of Patterns

“A mathematician, like a painter or poet, is a maker of patterns. If his (or her) patterns are more permanent than theirs, it is because they are made with ideas.”
 
G.H. Hardy, the famous British mathematician, wrote the above in his book A Mathematician's Apology (though I added the 'or her' in italics). I often ask students and adults what is Math the study of and whilst most say something along the line of 'the study of numbers' very few say what Hardy was getting at:
Math is the study of patterns.
Sometimes it is patterns in numbers (and these patterns can help us compose and decompose numbers as well as operate with them). Sometimes it is patterns in shapes, or how we measure things. Sometimes it is patterns in data. When I tell students this it is very liberating because human beings are born with the capacity to spot patterns (as explained in Professor Brian Butterworth's book The Mathematical Brain).
So we wanted to see how Grades 5 and 6 students would make their own patterns. Our original plan was to give students the first three terms of a pattern and then get them to predict the tenth term. I gave them the first term (shown below) and then went around each pair just to check that they had made it correctly on their desk.
What we noticed happening though was that students started doing the second term themselves, even though I had not told them to.
I know. The cheek of it!
But here are some of their examples:


 This was the pattern we had expected. What we got was more interesting. Students could now be asked to look at other students' work and to describe the pattern as well as predict what the tenth term would look like. The students' conversations were full of reasoning and proving based on the variety of patterns that they had created. It was so much better than forcing them all to work with the same pattern.
 
So we were a bit surprised when we tried this exact same approach in a different class the next week. Just about all the students created the L-shaped pattern and the conversations weren't as rich:
"What's your pattern rule then?....Oh it's the same as mine. Wow."
So we quickly opened it up and asked them to create their own patterns without giving them the first term. This is what we got:

Now, the conversations were a lot richer. I am convinced that this was a result of the greater variety in the patterns.
So the lesson learned was this:
Students must be allowed to create their own patterns so that they will develop the ability to ask questions about other students' patterns.

Tuesday, December 11, 2012

A Must-Fix Misconception

I love the quote on the nrich.maths.org homepage (highlighted below)

I don't think it is any secret that division is the least understood of the four operations. There is often a lot of noise in the media (from people who have never had to teach math to elementary students) that students must learn long division. Right now (as I'm typing this) I'm trying to remember the last time that I had to do long division: it was way, way back. Most situations I can deal with using good number sense to get a good estimate. If an accurate answer is required, I might pull out a calculator (why bark yourself when you have a dog? as we say in Yorkshire). And if I have to do a bunch of such calculations, I'd use a spreadsheet.
But by focusing on long division, a more pressing concern is overlooked: students don't understand division. And learning the standard long division algorithm does not teach students (or adults) what division is. Students understanding of division should begin concretely by actually doing some division in the two most common situations: sharing and grouping.
For example, if these cubes represented 23 cookies:
and if these are shared between three people, then each person gets 7 cookies with two left over. This is a sharing situation:
 
If the cookies are to be put into packs of three then we will get 7 packs with two left over. This is a grouping situation:
 
 Both situations, though different, are represented by the same number sentence (23 ÷ 3 = 7 with 2 remaining). Students must experience both sharing and grouping situations that involve remainders so that they develop a solid schema of division situations. Students can then develop from concrete representations of division to diagrammatic representation to symbolic representation. Not just jump straight in to long division.
There are also some other misconceptions that are ignored by focusing on long division. I asked some Grade 6s to complete the following two statements:
Multiplication makes numbers...
Division makes numbers ...
 
 The whole class agreed that multiplication makes numbers bigger and that division makes numbers smaller. Rather than tell them that this was not necessarily true, I wrote down the following two questions:
8×10=…      8×2=…     8×1=...     8×0=…
After they gave me the answer to 8 times 1, I asked again "Does multiplication always make bigger?" Puzzled looks quickly gave way to smiles of recognition. "No, sometimes it makes the same!" was the agreement. After we agreed that 8 times zero is zero students were calling out "...and sometimes multiplication makes smaller." One student summarised it neatly thus:
"Multiplication can make bigger, stay the same or make smaller... it just depends on the number you multiply by."
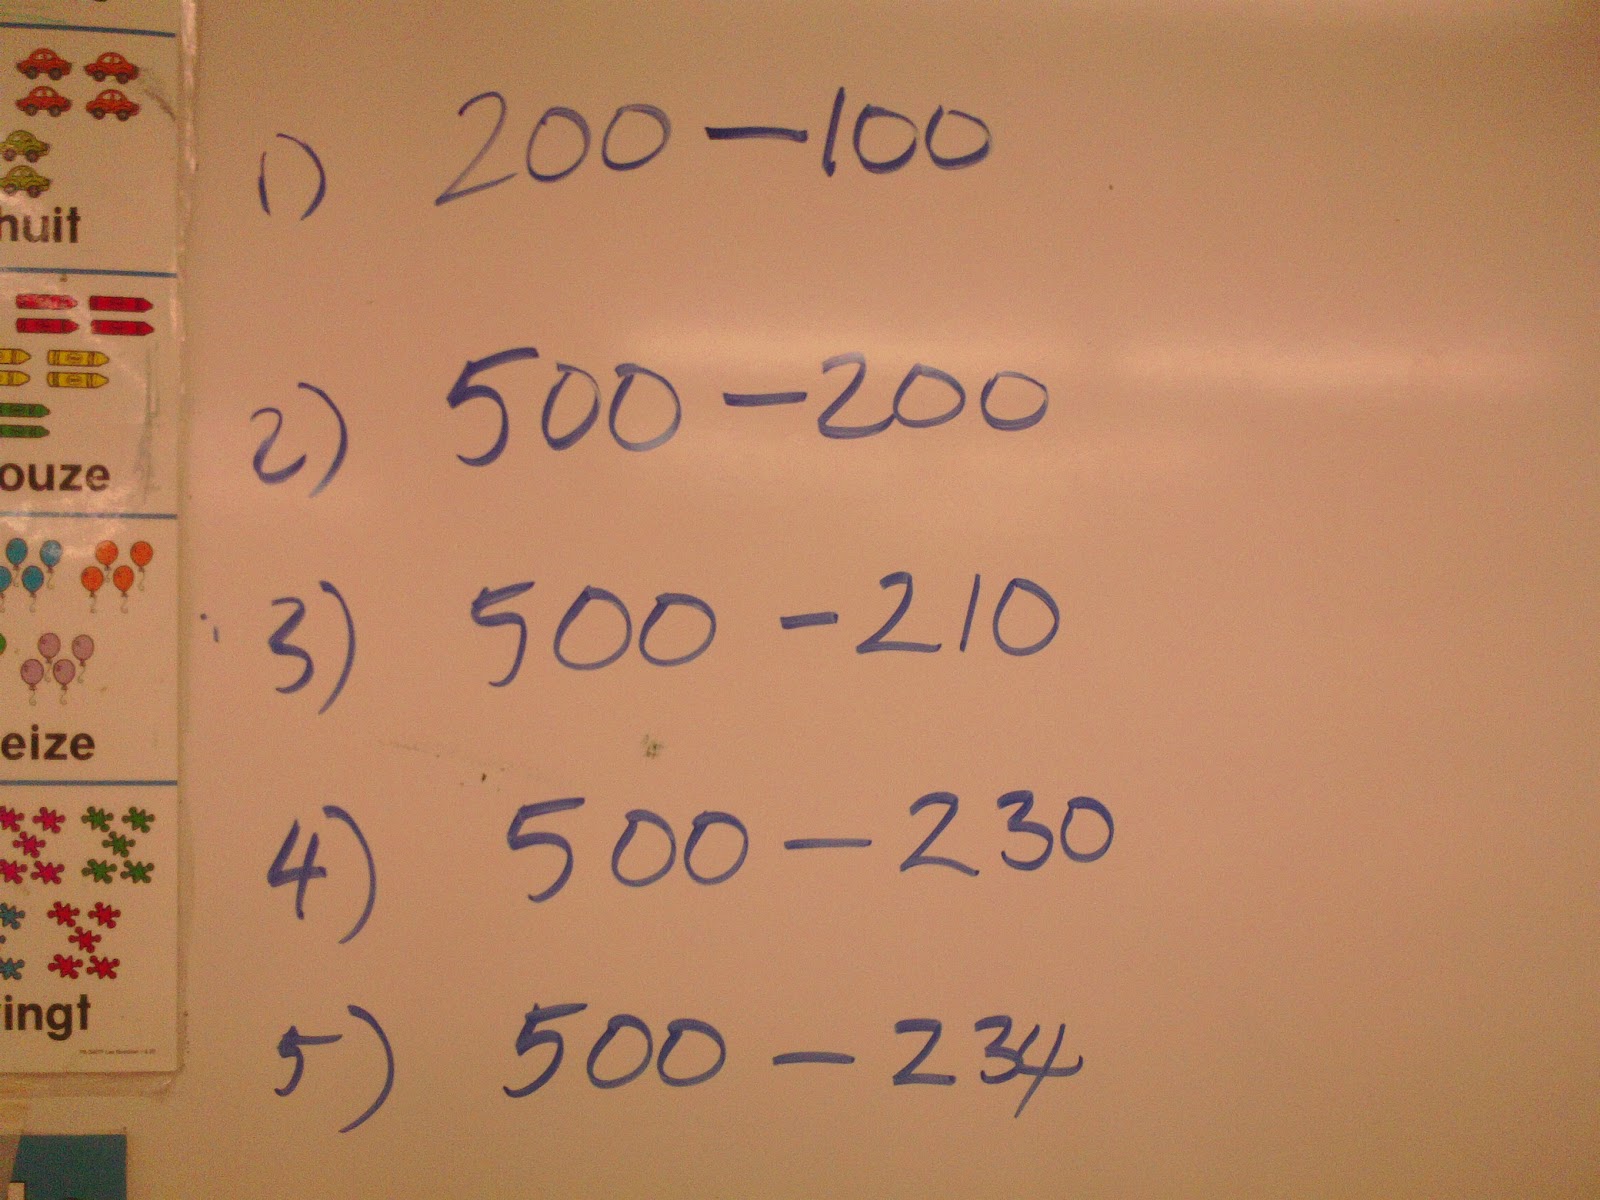
I repeated this process for division using the following string:
10÷5=...      10÷2=...    10÷1=...    10÷½ =...
The class quickly agreed that division could also make bigger, stay the same, or make smaller depending on the number you divide by. Their huge misconception had been drawn out into the open and addressed. To emphasise why this is important, I should tell you that I have given this question to adults on many occasions:
½ x = 24
and sometimes as many as two-thirds of them have told me that the answer is 12. They go on to reason that to find x they have to do 24 divided by a half which gives 12 which makes sense since  division makes smaller!
We consolidated this learning by playing a game called Target. The Target game is very effective in getting students to understand that multiplying doesn’t always make a number bigger, and likewise, division doesn’t always make a number smaller. Students play this game in pairs with the use of one calculator. A starting number (e.g. 37) is chosen as is a target number (e.g. 100). The first player uses the calculator to multiply (only multiplication is allowed) the start number by any number to attempt to get the target number. If he or she gets 100 exactly or ‘100.something’ then that student wins. If not, the other student gets the calculator and tries to multiply the new number by another number to get the target number. Play continues this way until a winner is found. It is most engaging!


Tuesday, December 4, 2012

88.2% of statistics are made up.

The British comedian, Vic Reeves, once quipped that "88.2% of statistics are made up." I thought of this when I saw the picture below:
Getting our students to be statistically literate must be one of our moral imperatives. This would partly involve developing our students' ability to ask the right questions in order to collect the right data so that they can display it in the clearest way. But we also need to help our students develop the ability to question any data that is presented to them, to see through the noise of misleading data and to reflect on such things as the sources of the data.
We gave the following question to a Grade 7/8 split class:
You are the CEO of a company that makes plastic water bottles. You need to create two graphs. One is to convince shareholders that you are making a profit. The other is to convince the Ministry of Environment that your company is environmentally responsible.
We purposely avoided giving them actual data to work with as we were more interested in how they would take into account that they have to present information to two very different audiences. Some used a single line graph and plotted time against the number of bottles sold:
Others created a double line graph, plotting their company's profit against another's over time:
For the second graph, some plotted the number of their bottles that were being recycled whilst others plotted the amount of 'pollution' over time, again compared to another company:
We then allowed students to go on a gallery walk and give feedback on other students' work.
They were reminded beforehand (as recommended by Dylan Wiliam) that the best sort of feedback is not ego-centred ('Great job') but task-centred and generally they were true to this. In the example below, students were asking how the author could possibly predict future sales. I like that!

In our consolidation we posed some further questions to the students:
1) Does it make more sense to have time measured in months or years?
2) Does it make more sense to have 'profit' or 'Number of bottles sold' on the y-axis?
3) How do you measure 'pollution'? Or how do you know how many of your bottles are recycled?
The ensuing conversation brought out a wealth of reasoning, proving and reflecting.
Afterwards, the teachers and principals who were observing remarked how this lesson could have easily have been a Media Literacy lesson.
Some recommended resources:
1) http://visual.ly/ has a huge amount of infographics that will be sure to kickstart some great data discussions.
2) http://nces.ed.gov/nceskids/createagraph/ I have never, since I started working in 1990, ever had to draw by hand a graph of any sort. All those hours spent converting data to percentages, then multiplying these by 3.6 to get degrees and then using these to draw (with a protractor) a pie chart were hours spent in vein. The Create-a-Graph site is very user-friendly and allows students to enter their data and choose the most appropriate way to display their data. After all, people in the real world will use technology to create graphs and charts, not be forced to draw them by hand.
3) Darrell Huff's How to Lie With Statistics although written in the 1950s is still wonderful reading. If you read it (I believe it can be downloaded for free now) you will become a better teacher, 100% guaranteed!

Thursday, November 22, 2012

The Penny Drops

So I learned something this week that I'm kicking myself for not seeing earlier. Marshall McLuhan famously said 'The medium is the message'. Today I am wondering if:
The medium determines the math.
I was in two Grade 2 classes in two different schools. Both were working on composing and decomposing money amounts and both were given the same question:
How many different ways can you make 31 cents?
The first class had a small amount of plastic coins on their desk and were asked to record their solutions in their math books.
The second class had a larger amount of plastic coins and were also asked to simply leave each solution on their desk. They were also told that they could not use more than eight coins for each solution.
The second group ended up doing a lot more math than the first. They quickly got solutions for 31 cents so we then challenged them with 82 cents. The first group on the other hand were slowed down by the act of recording their solutions. For most, this meant drawing the coins although some did write a number sentence. This wasn't necessarily a bad thing as they were still composing and decomposing money and we later had a good discussion about different ways to represent our thinking.
But it just took them so long!
And it wasn't because there was a difference in the ability levels between the classes; by listening to the students' explaining their solutions I got the sense that there their number sense was very similar. It's just that the second class had more opportunities to use their number sense and this has to be a good thing.
In terms of evidence of student learning, it was easy to take a photo of the students' work:
Some other thoughts:
1) I really liked restricting the number of coins: it forced students away from the time consuming 1+1+1+... solution and made them think in bigger denominations. This is definitely what they will need in the real world.
2) I also love just giving students a handful of coins and asking 'how much?' Again, this is a real world skill and does not require that the students write down their solution.
3) Questions like this one (from Ontario's Grade 3 EQAO test in 2007) annoy me:
This is a perfect example of a question that is meant to be real world but actually is anything but. The ball and skipping rope cost $4.10 in total. Jorge isn't going to dump all his coins on the counter and say 'There you go!' to the shopkeeper and wait patiently for his change. I would hope he more sensibly gives the shopkeeper the toonie ($2 coin), loonie ($1 coin), four quarters and a dime. Or maybe five nickels instead of a quarter, and a nickel and five pennies instead of the dime so that he can get rid of a lot of his loose coins (or shrapnel as some say) as this is what I do. Either way, though, he would not get any change because he gave the right amount because this is what happens IN THE REAL WORLD!

Monday, November 19, 2012

Discrete and Continuous Data

What is discrete data? Is it data that says "Shh... don't tell anyone this"? And what is continuous data?
More importantly, is it possible to get Grade 5 students to understand the differences between the two?
In fact, what is the best way to get any student to learn how to handle data? Filling in blackline masters? Hand-drawing pie graphs after changing the data to percentages and then multiplying each percentage by 3.6 to get the number of degrees and then using a protractor to measure these?
To me, the ability to handle data is so much more than this. It is about:
  • asking the right questions to get good data
  • thinking about the most effective way of displaying the data, with your audience in mind
  • interacting with the data: is it biased? Valid? What are its implications?
For example, I would hope that my students would be able to look at this pie graph...

... and say that it makes no sense to present this data as a pie graph.
I tool part in a lesson study recently with the focus being on handling data. We were going into a Grade 5 class and the teacher was concerned that her students didn't know the difference between discrete and continuous data. What was quite telling was that as adults there was some confusion regarding this too and it took a lot of discussion with a lot of different examples before we all had some level of comfort with these terms.
Our 'Minds On' for the lesson was what does 'handling data' mean? The students were pretty good at saying that data is just information and that we need to try to make sense of this data. We used the following infographic from http://visual.ly/what-infographic-2 to sum this up:

What is an infographic? Infographic


We then got them to create a bar graph about their shoe size by using their actual shoes. We created three such graphs: one with all the students' shoes, one with just the boys' shoes and one with just the girls' shoes (below).
The students then had a great discussion as to why the boys' shoes were more 'spread out' than the girls' shoes.
Next we measured the students' heights and got them to create a living histogram. We used intervals of 10cm e.g. 110-120, 120-130 etc.
Again, we created a histogram just with the boys in and another one with just the girls in and again had great discussions as to why there were differences.
Now came the tricky bit: could we use this activity as a way of getting students to see the difference between discrete data (the shoe sizes) and continuous data (the heights)? We asked the students what was different about the 'shoe size numbers' and the 'height numbers'?  A lot of conversations centred on the idea that the heights were measured but that the shoe sizes weren't. Then one student suggested that for the heights you could always find 'numbers in between' but that you couldn't do this for shoe sizes.
"Yes you can, you can have 3 and a half," shouted out one student.
"But can you have 3 and a quarter, or 3 and an eighth?" I asked. Quickly the class agreed that shoe sizes can only have certain numbers but heights could have any numbers. To emphasise this, we used a number line on Geogebra and simply kept on zooming in on the 140-150 interval. As the decimals changed from tenths to hundredths then thousandths and beyond one student said "Wow, you could go on forever doing that!"
And then another said "Yeah, it's like those numbers are continuous!"
It is very hard to suppress a huge Cheshire-Cat-smile when something like this happens!
We summarised like this:
Discrete data can only have specific values, often (but not always) just whole numbers.
Continuous data  can take any value.
We ended by asking students to give their own examples:
Number of students in a class? Discrete.
Amount of pop in a bottle? Continuous.
Amount of time it takes to get to school? Continuous.
Number of siblings? Discrete.

Monday, November 12, 2012

Nets of Prisms

I think that if you were to ask most people what a net of a cube looks like, they will say a cross shape. Very few though will know that there are in fact 11 different nets. I've challenged both students and adults to find all 11 and it never fails to get everyone engaged. But this is mainly because of the manipulative that we use: Polydrons. Here it is easy to quickly check if a net does or does not work. It is also great to have a good old think about what congruence means and how two 'different' net are in fact the same if one is a reflection or rotation of the other.
I was in a Grade 3/4 split class recently and we were hoping to do this nets of a cube investigation. However after a quick glance at the bucket of Polydrons, I realised that I would have to change things a bit: there were not enough 'square' Polydrons. We would have to find nets of triangular prisms instead. This was going to be a ton of fun for me too as, off the top of my head, I didn't know how many such nets existed.
I started the lesson by showing a net of a cube (the one shaped like a T) and asked them to predict what this 2D shape would fold into. Most predicted a cube (some said a box, some said a square) and everyone was quite happy when I showed them that indeed this was the case.
I then held up a triangular prism and gave them the challenge:
Find as many nets as you can for this shape.
There was one catch: they had to tell how many of what shapes they needed. Rather than giving them two triangles and three squares, I wanted them to think about what was required. They were all able to do this even though I didn't hold up the prism for very long. In fact, I could see a lot of students trying to visualise what was needed (you know that look, when they seem to stare at a spot on a wall and have their hands in front of them holding an invisible prism?)
In a short space of time we got the following:
This was pretty much the first one that most students did.
And each time I responded with "Great! Now make a different one." And they did!


When students came up with congruent nets we had great discussions that led us to agree that even though they looked a bit different, mathematicians say that congruent nets are in fact the same net.


The wonderful thing about Polydrons is that students can easily reason and prove if their nets do work as seen in this clip:


Planning the consolidation with other teachers and principals was fun. I was asked how many nets existed. "Well, I think there are six as that's how many I've found," I said. In a flash, my buddy Mansel had corrected me (with a little help from Google I think!): there are in fact eight. So we set as a challenge to the class: they had found four, now they had to find the other four.
The other thing we wanted to check is do they really know what a prism is? Their own explanations were on the right lines but far from exact. So I used an analogy which has helped many students (and teachers) in the past.
A prism is like a loaf of bread: you can cut it from front to back and each slice is always the same size and shape.
I have found that this draws their attention to two important attributes that in later grades will be very important for working out the volume: the slice of bread is the area of the cross section and the number of slices will represent the 'length' of the prism.
For this class though it was enough to say that the shape of the slice tells us the name of the prism. Holding up a cube, I asked them what this could also be called. After a quick discussion, most groups agreed that it could also be called a square prism.
Or squarular prism as one student said.
I later showed the adults some paper cups that you get in fast food joints for getting ketchup and asked them what is the net of this shape. Most people are surprised when you unwrap the cup. Try it!
I then showed this photo I took recently and asked "Is this a prism? And how might you work out its volume?"


Monday, November 5, 2012

Using the Empty Number Line to Subtract

One of the best bits of advice that I ever got (and now pass on to students, parents and educators) is this:

Good mathematicians look at the numbers first before they decide which strategy to use.
 
I was in a Grade 4 class recently and the teacher was concerned that she had some students who had trouble doing the traditional algorithm. My concern with the traditional algorithm is not that students shouldn't learn it but they should learn when to use it. This is fast becoming a forgotten skill. Ask yourself if you need to use the traditional method to do the following:
 
1) 1000-5
2) 1000-998
3) 400-320
4) $10.00 -$2.25
5) 17-8
6) 800-481
7) 5028-2279
 
I would imagine that most people would do all of these in their heads with the exception possibly of #7 (and maybe #6 too). That being the case, we need to get our students to do so too.
To help students develop this skill, I began by writing the following number string:

I always make the point of writing the question horizontally and not stacking the numbers; it nudges the students into thinking of non-standard approaches. Students wrote their answers on their personal whiteboards and I would say that whilst most just wrote the (correct) answer, there was a core who wrote the algorithm for each question. So I asked the class if it was always necessary to use the algorithm.
Some said yes.
Some said no.
No surprises really. I then asked how they did #5 above. A common method was to subtract the 200 from the 500 to get 300, then subtract the 30 from this to get 270 then subtract the 4 from this to get 266. I represented this on an empty number line:


We then gave students some follow up questions. Some used the empty number line to model their thinking:
Others stuck to the traditional algorithm but it was becoming clear that this was causing issues for them. When attempting 800-481, this student (who at first thought the algorithm was better) had an a-ha moment:
Not successful with the algorithm, but successful using good number sense. He felt pretty good about himself.
There remained a couple of students who insisted that the algorithm was always the best method. One student worked out 100-68 traditionally and when I asked if he could work out 100-60 and 100-70 could only do so with the algorithm:
To me, this is a clear case of when the algorithm is introduced too early it actually undoes number sense.