Coding is a new expectation in Ontario's Grade 9 De-Streamed math and is an area where a lot of my colleagues have asked for support and resources. Trying to figure out exactly is requires has been tricky: the MOE has yet to provide teacher supports in the form of examples, key concepts and sample tasks. However, my own sense is that there is a lot of good that can come when aim to use coding to intentionally learn about math concepts as opposed to coding things like Mario-type games. For this reason, I created a series of short Coding Challenges for the Grade 9 teachers to use with their classes and I have been in a number of schools trying these out.
Before I start any class, I ask what coding languages they have used before. The vast majority of students are familiar with Scratch (used mainly to create the aforementioned Mario-type games) but there is always a couple of students who have learned Python, Javascript or C++. I tell these students that although I will be showing the class a Scratch code, they are more than welcome to use the language of their choice to create a similar code on the condition that they explain this code to me later.
I thought it would be good to get students to write some code that would produce a list of numbers as this is something that would tie in to some of the expectations from the Number strand. A nice introduction to each code is to provide a flowchart and ask the students to use this to write a list of numbers:
I'm quite happy to let the students struggle through this as their mistakes are often a result of not following the instructions precisely; this is something we need to bear in mind when we are coding!
After 10 minutes or so, we regroup and once we have agreed on how to follow a flowchart (and what numbers we should have written down), I give them a simple example of how this can be written using Scatch:
Care is needed her in building up the 3x+1 function: the same care that is need when using order of operations. This in itself is a worthwhile lesson. When students have successfully recreated this code, I ask them to alter it for these functions:
Now this code is something I produced and I am so far from being considered an expert coder, so I always can challenge students who have finished quickly to improve my code. One teacher noted that the output for the above code:
lacks a bit because it only gives the y-values, and that it would be better to see a pair of co-ordinates. I was initially unsure how to achieve this, but after watching what some students were trying, I came up with this:
Much better, I'm sure you would agree!
In a different class, students had already completed some of the coding challenges so we tried a different approach. We gave them the actual code and challenged them to follow this (instead of the flowchart) to create a list of numbers:
What I liked about this approach, is that we didn't have to spend time consolidating after they had written their answers: we simply asked them to recreate the code and see what the output is (in this case it is the... well, that would be telling wouldn't it?!) The students were then able to make sense of the code (especially the last two lines).
My challenge for this code was to improve it so that the user can choose the first two numbers (as opposed to starting with 1 and 1). It isn't long before students come up with something like this:
Now I can ask one of my favourite questions:
Choose two starting numbers that will give you 1000 for the twelfth term.
As students work their way through this, some good questions come up:
are there any whole number solutions?
if you are using decimals, how close can you get?
how can you be more efficient in your search?
One student really took this last idea to hand. By fixing the first two numbers to be the same, he created a code that checked every possibility starting from ) 0.0001:
In another class, we started by giving them the flowchart for the wonderful Hailstones Numbers:
As students worked through this, some questions quickly emerged:
is there a number which doesn't lead to a 4-2-1 loop?
is there a different loop that a number can get caught in?
what is the longest amount of numbers that can be written before getting caught in a loop?
In this class, the teacher had been getting the students to write the Scratch code on their own and only showing them my code if absolutely necessary, so this is what we did for the Hailstone numbers. One challenge here is how to code the bit where we have to check to see if a number is even or odd. This necessitated a little interlude on modular arithmetic and 'if.. then...else' statements, but eventually led to this code:
On a side note, one particular student needed some extra examples to help him understand mod arithmetic but when the penny dropped, he declared with a massive smile: 'Mod arithmetic is really cool!'
As students used their code, they surmised that it would appear that every number gets stuck in the 4-2-1 loop. I challenged them to change their code so that the list stops at the first instance of 4-2-1 and tells us the length of this list. One student came up with this:
This is his explanation of the code:
We ended the class by relating the story of Fermat's Last Theorem and how this easy-to-understand problem eluded proof for centuries until Andrew Wiles heard about in a school math class and then devoted himself to this proof which he eventually achieved after 7 painstaking years. I then told them that Hailstone numbers are also referred to as the Collatz Conjecture and whilst mathematicians think that all numbers end in the 4-2-1 loop, no-one has actually proved this.
'Maybe one of you here is inspired by this story, like Andrew Wiles was inspired by Fermat's Last Theorem. And maybe one of you will, years from now, create a beautiful proof for this and claim the $1 000 000 prize for doing so.'
This got them excited!
'If so,' I continued, 'Don't forget to seek us out and at least buy us a cup of coffee!'
* * *
Personally, I have learned the following:
Coding can be a really great way to explore many math ideas that are in the new curriculum and it can be done in a way that doesn't feel like an addition.
Have the students work with a coding buddy: shared thinking (even shared devices) lead to stronger learning.
Have some extension questions ready to go for those that finish quickly, and don't feel that you need to have the answers to these: trust the students to find a way and be happy to learn from them.
Be happy sharing your mistakes with the students, and show students how you talk through your thinking when de-bugging this mistake.
I always like doing Number Talks in classrooms but my experience with these has mainly been with elementary students. So I jumped a the chance of trying one out with high school students last week. These were Grade 9 students in the new de-streamed math course here in Ontario. As the students were going to be working on a task looking at car depreciation, their teacher wanted to kick-start their thinking on finding percentages of an amount. This is the number talk that we gave them:
Find:
50% of $64
10% of $64
20% of $64
5% of $64
15% of $64
We asked the questions one at a time and students wrote their answers on individual white boards which they then showed us.
Everyone was happy enough with the first question: some said you just find half of $64, others said you divide it in 2. I was able to illustrate this using a simple bar model:
The second question caused a bit more thought. Whilst some wrote $6.40, others wrote $6.4. One or two students quietly told me that they thought it was a bit more than $6. I asked the students who had written $6.4 'How many dollars and how many cents is this?' There were some who had the misconception that this meant six dollars and four cents. (This is often an issue if students are calculating a percentage on their calculator).
Returning to my bar model, I asked how I could split it to get 10% partitions.
Once they told me ten parts, I could then emphasise that 10% is our 'Golden Percentage' as it is friendly to calculate and useful for creating other percentages. We could also split the $64 into $60 and $4 to show that 10% of each of these was $6 and 40 cents respectively. This helped address the '$6.04' misconception.
The third and fourth questions were then solved very quickly and successfully which just left the 15% of $64. Most saw this as '10% + 5%' but one or two saw it as '3 times 5%' and one person did '25% – 10%' which I have not seen before.
All of this allowed us to emphasise that part of being a good mathematician is being able to split things up and then put them back together (or, to be technical, decomposing and recomposing)
We then split randomly grouped the students into groups of three and assigned them to vertical whiteboards to work out 8% of $64 in any way they could think of. We knew that this is something they would have learned in earlier grades, we expected them to use their calculators to do 0.08×64
Instead we got a variety of different methods that connected to the Number Talk:
Using a ratio
Find 20%, subtract from 100% to get 80%, ÷10 to get 8%
Find 1% then multiply by 8 to get 8%
Find 5% then add three lots of 1%
Find 40% then ÷ 5
Find 10%, ÷5 to get 2% then take this off 10%
It was great to see all these decompositions and I can only think that this strengthened the students' number sense. At the same time, we also drew their attention to the fact that sometimes the numbers might not be so friendly, in which case multiplying by 0.08 might be the better option.
All of this prepped them perfectly for the car depreciation task.
In order to consolidate what they had previously explored on sinusoidal graphs, we gave the students the Marbleslides Periodics activity. Half of our students were with us and the other half joined us via Zoom (their teacher provided them with the class code).
Engagement was not a problem: all students got stuck into the tasks straight away and we could use the teacher dashboard to see which students needed prompts and which ones did not. If a student at home needed the prompt, the teacher sometimes did this quickly through Zoom.
We had set the activity up so that we were both co-teachers which meant either one of us could use the feedback button to give feedback to the students working at home.
In addition to the conversational and observational evidence that we were getting we could also use the students' responses to some of the 'Predict' questions (shown below) to provide feedback.
By using the 'Snapshots' tool, we could take some responses for a particular question and look at these with the whole class (those in the room and those working at home). We could then give feedback as to how we could improve these answers by using more precise mathematical terminology.
It was during the Challenge Slides that we really could see that the students had a solid understanding of sinusoidal graphs: conversations were littered with suggestions such as 'Change the amplitude', 'Shift it up', 'Change the b value and it will stretch the graph out'.
Challenge 4 was a sticking point though:
Students had no problem getting a graph that went through the stars but with the marbles being dropped vertically from the point (0,12), they just settled in a dip without collecting any stars.
At this point, I was a bit stumped too so we stopped the class to try and think our way out of this. I made the point of telling the students that I was stuck and that this often happens when you do good problems. I wanted to model what I do when I get stuck so that they could develop these strategies too.
Firstly, we confirmed that we had pretty much exhausted all the potentially useful transformations.
Then we mused: why don't these work? We agreed that it was the position that the marbles were being dropped from. This of course begged the question: 'if we could change something, what would we change?'
Well, in this case we would like to change the position that the marbles are dropped from. I do confess that I did try to drag the launch point but to no avail!
So if we can't change the position of the drop, what else could we do?
Then the penny dropped (or rather, the marbles): We could divert the marbles.
How could we divert the marbles? With a second sinusoidal and by using domain restrictions!
I then noticed the instructions on the page:
In the rows below, type as many equations of periodic functions as you need to collect all the stars.
Well played, Desmos. Well played.
After a quick exchange of ideas as to what this second graph could look like, the students came up with some great solutions:
It is one thing to hear the cheers of the students in the class as they are successful at each challenge, but it is another thing when one of the students working at home sent this message via Zoom:
Of course, this is all very well but if the students are just being entertained by marbles sliding down ramps and collecting stars, does that actually mean they have learned anything?
After the lesson, the teacher stated quite simply this:
'They get it. They totally get it.'
'It' being the overall expectation we were focussed on:
Demonstrate an understanding of periodic relationships and sinusoidal functions, and make connections between the numerical, graphical, and algebraic representations of sinusoidal functions.
'I can give them all level fours get it and not worry about giving them a test.'
This was important: with face-to-face time at a premium, any time spent on tests takes away from this. There will be situations where a product (such as a quiz or a test) might be a better way to assess or evaluate our students, but my sense is that if we look more closely at our overall expectations, we will see that many of them lend themselves just as nicely to activities such as this where we can use our observations and conversations to assess and evaluate.
More importantly, the first line in Ontario's Growing Success document should be guide our assessment and evaluation practices:
'The primary purpose of assessment and evaluation is to improve student learning.'
Teachers around the world are facing many challenges as we get to grips with new schedules involving online learning, cohorts, quadmesters and even octomesters. For many, the reduction of face-to-face time with their students (the most valuable relationship) has teachers feeling increased pressures in effectively delivering any particular curriculum. I wonder if, now more than ever, we need to focus on the big mathematical ideas of each course.
Last week, I worked with a teacher of a Grade 11 class who were about to begin trigonometry. There are many specific expectations in the Ontario curriculum which (if you only see your students face-to-face for two or three mornings every two weeks) can be overwhelming: where to start?
Instead, we looked at one overall expectation:
Demonstrate an understanding of periodic relationships and sinusoidal functions, and make connections between the numerical, graphical, and algebraic representations of sinusoidal functions.
What activities could we give our students so that they could demonstrate an understanding of all of these especially given the scheduling constraints (a 2.5 hour lesson on Wednesday and Friday for one cohort and a 2.5 hour lesson on Thursday for the other cohort)?
For me it boiled down to this:
Mathematicians need to describe how things move in circular paths or behave in regular cycles.
The Unit Circle is key to understanding trigonometric ratios and can be connected to what they know about right-angled trigonometry.
The Unit Circle gives us the sine and cosine graphs, and we can see how these are connected.
We can transform these graphs in a number of ways similar to what we have learned with other functions.
These are the activities that we did and (spoiler alert) allowed the students to demonstrate their understanding.
1) Graphing Stories
As a minds on we gave them two videos from the excellent Graphing Stories site.
Plot the height of the waist above the ground:
The distance of the person on a roundabout from the camera:
Both videos are by Adam Poetzel (Twitter: @adampoetzel).
I made sure that students had the chance to watch each video four times so as to allow them to improve their sketch graphs each time. Once we had done these, I could point out that straight line motion results in graphs with straight line segments. Circular motion, on the other hand, results in a wavy graph that repeats itself.
I could now tell the students that we were going to learn about the second type of graph.
2) Redefining Sine and Cosine
As an interlude, I asked them to write down a definition of what they understand 'sine' means. This puzzled them for a bit, so I rephrased it and said, 'Draw a right-angled triangle and use this to describe what we mean by the sine of an angle and the cosine of an angle'.
This worked much better: they were confident in telling me that:
sin θ=opp/hyp and cos θ = adj/hyp.
This begged the question: what is the largest value that θ can have?
After a bit of debate, they agreed that θ had to be less than 90˚.
I told them that if this is the case, then our current definitions of sine and cosine would not help us with this triangle:
We could use the cosine law, of course, to find the missing side but this means that we have to find the cosine of 140˚. To do this we have to redefine the sine and cosine functions.
3) The Unit Circle
I used a Desmos graph to show the students what a unit circle and by seeing the right-angled triangle formed in the first quadrant, we can now define the cosine of an angle to be the x-coordinate associated with that point and that the sine of the angle is the y-coordinate of that point.
From here, we can see straight away the values for the sine and cosine of 0˚, 90˚, 180˚, 270˚ and 360˚.
The unit circle is a powerful mnemonic device so I recommended that they get used to sketching it!
4) Connecting the Unit Circle to the Graphs of Sine and Cosine
I asked the students to sketch a graph and plot the known values for sin θ between 0˚ and 720˚. They got something like this:
Now, it was a case of asking them to 'fill in the gaps' and sketch the complete graph. They all did this successfully and I reckon that the graphing stories they did earlier helped them see this. I did the same for the known values of cos θ between 0˚ and 720˚:
Again, they were successful. Now I could show them this lovely Desmos graph to confirm what they told me:
With these two graphs established, the students could tell me:
that the maximum and minimum values for sin θ and cos θ are 1 and ¯1.
that the cosine graph is just a sine graph shifted to the right (and vice versa)
that these neverending waves (which we can now call sinusoidal) are made up of repeating periods, and that the length of one of these periods is 360˚
5) Transforming Sinusoidal Graphs
Next, I grouped the students into threes and had them stand (socially distanced, of course) by a whiteboard, with each person having their own marker. They had downloaded Desmos on their own devices and I quickly showed them how to scale the axis so as to allow us to work in degrees.
Their task was to find out the effects of each of the following transformations:
y=sin x +c
y=a sin x
y=sin (x – d)
y=sin b x
Since they had already explored transformations of other functions, they were able to tell me what each of these effects were. With a bit of further provocation, they could tell me that the 'a' value gives us the amplitude of a sinusoidal graph (a measure of how 'tall' the waves are) whilst the 'b' value can be used to calculate the 'length' of one period of any wave.
I finished the lesson by asking them to make sure that they summarised what they had learned in a short note. I told them that this note would be useful in the next lesson when they would combine two or more of these transformations.
Afterwards, I chatted with the teacher and we both agreed that we were pretty convinced (through conversations and observations) that the students had a solid understanding of the overall expectation. The Desmos activity that I had planned for the next session would confirm for us how solid this understanding was.
I cannot think of a better tool to help students understand elapsed time than empty number lines. I was in a Grade 4 class and began by asking them to show me various times on their individual analogue clocks. I have blogged before about the importance of making sure (as teachers and parents) that children are familiar with analogue clocks so I was happy to see how adept all these students were with showing me a variety of times. As it was 8:30, I set them a challenge:
What will you be doing in two-and-a-half hours?
As I moved around the class listening to and watching the students thinking, I noticed that some were using the clocks to help them find the new time whilst others seemed to be using their fingers to keep track of their thinking. There were two common answers: 11:00 and 10:00.
I then told them how I 'see' this problem using an empty number line.
First, I mark the start time on my line:
Then I move forward two hours from this:
And finally add the extra 30 minutes:
One student then said that this was like how they have learned to add and subtract numbers: a good sign!
When we agreed that the time would be 11:00, they were able to tell me that they would just be beginning lunch.
I then gave them this challenge:
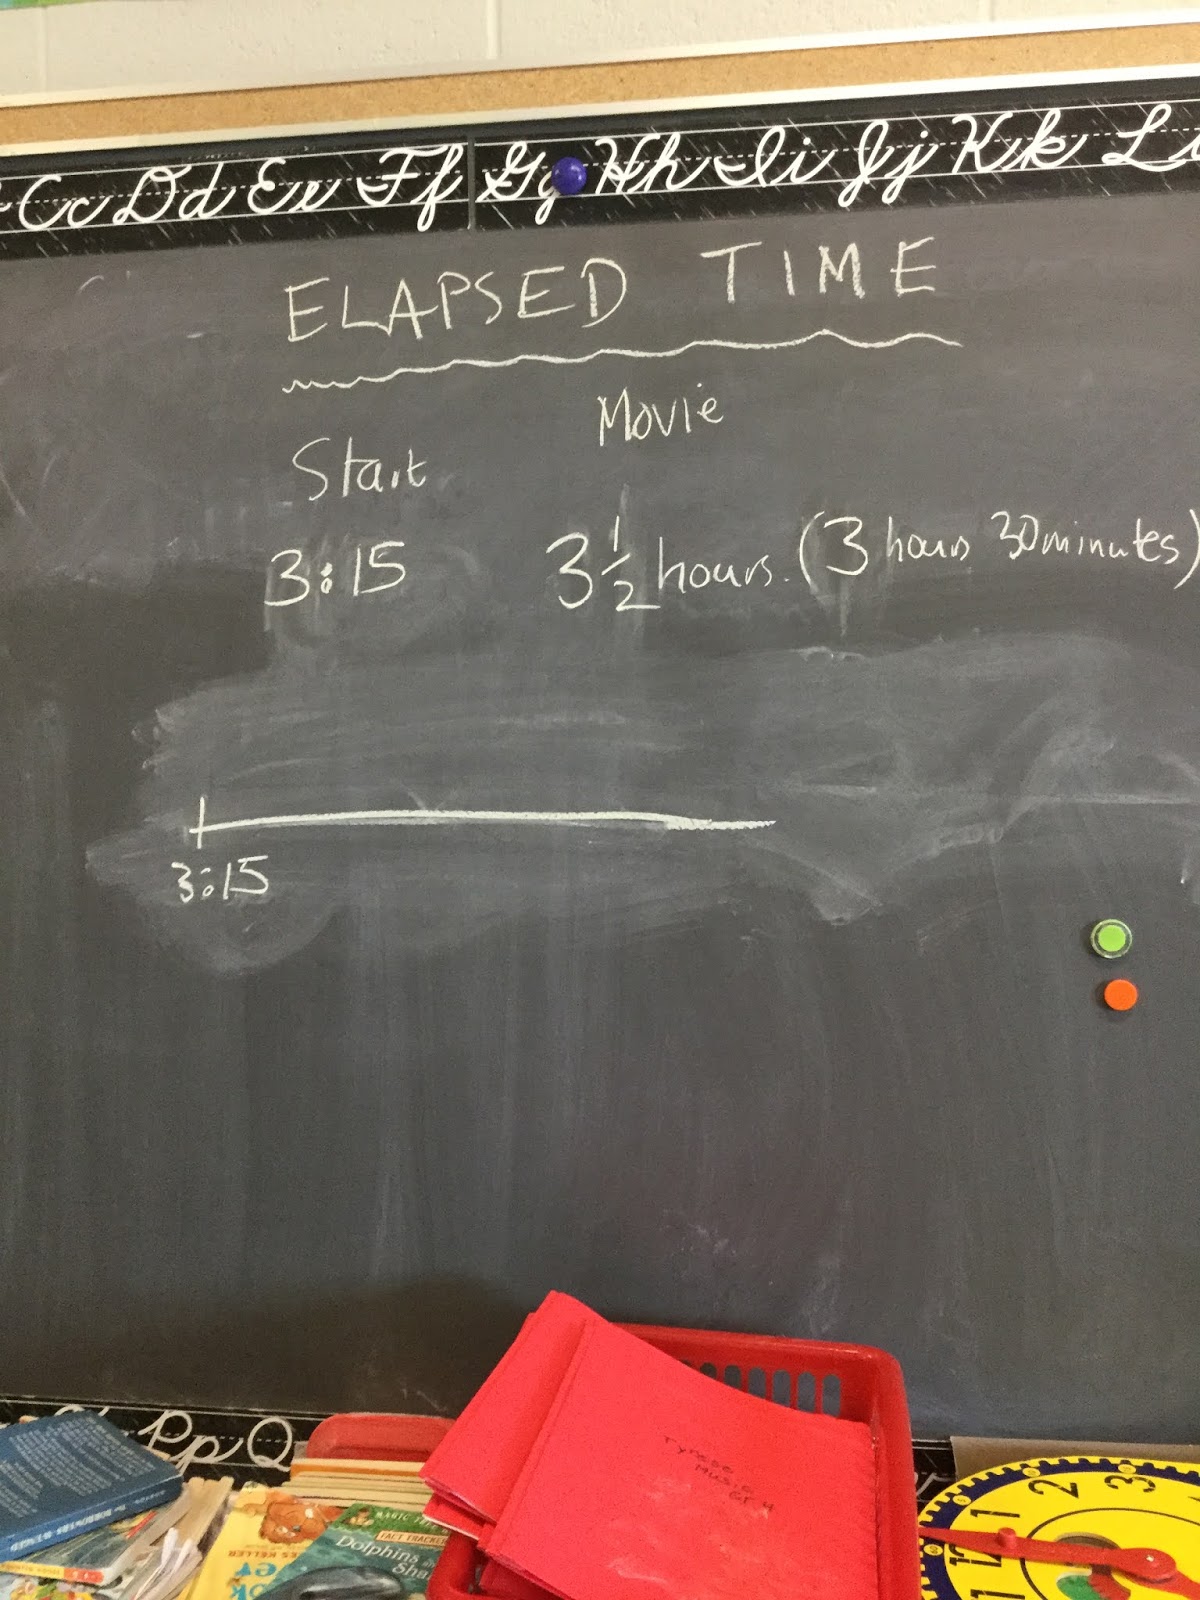
You are going to see a film that starts at 3:15 p.m. You know that it lasts three-and-a-half hours. What time will it finish?
As I moved around the room, I could see students making great progress by using the number line:
Some students used an analogue clock to help their thinking:
All were able to give me the correct time that the film finishes. My next challenge was this: Your train leaves Oshawa at 9:15 a.m. and takes 6 hours and 40 minutes to get to its destination. What time will it arrive. Again, the students used the empty number line effectively:
What I like about number lines, is that students use numbers that are friendly them and that these eventually will lead to more efficient strategies such that students (in my experience) begin to 'see' the number line in their head. I ended the lesson by giving this challenge:
It is now 9:25 a.m. If school ends at 2:50 p.m., how many minutes are there before you go home
Unfortunately, I forgot to take pictures of their solutions, but they were able to get the correct solution despite not being shown how to do problems like this: they just used the empty number line, marked on the start time and end time then figured out the elapsed time in ways like this:
I recently was in a grade 3 class and tried this activity with them to help them understand that perimeter is the sum of all the sides of a shape. To help with this, I cut five lengths from stir sticks with these measurements:
3cm, 4cm, 4cm, 5cm, 8cm
I used stir sticks as I wanted something thin so the students focus on the length of the segment and not its width (or even height). I also wanted to see how well these students were meeting the overall expectation: 'estimate, measure and record length, perimeter... using standard units'.
I started by asking the students to order the sticks from shortest to longest:
I then asked them to pick up the longest stick and asked them to estimate how many centimetres it was. I would say that about half the class had a reasonable estimate. To help them refine their answer, I gave them two benchmarks: firstly, that the width of their finger is about a centimetre; and secondly I held up a ruler and showed them what 10cm looked like. This helped all students refine their estimates and was worthwhile doing. Then, each student was given a ruler and asked to measure and record the lengths of the five sticks. What particularly impressed me with this class was that every student used the ruler correctly i.e. by lining up the zero on the ruler with one end of the stick. It was clear that there teacher has done some fantastic work on this already. I asked the students to round their measurements to the closest centimetre (which helped cover the fact that sometimes my cutting was not as accurate as it should have been!)
I then set the students a challenge:
Create as many triangles as you can using only three sticks and find the perimeter of each triangle.
Before they did this, I demonstrated (using longer sticks) how I wanted them to carefully place the sticks end-to-end. For the next fifteen minutes, they worked really well on finding as many triangle as possible. I was really impressed as to how much care they took in putting the sticks end-to-end and also how well they recorded their results.
I had carefully chosen the lengths of the sticks to limit the number of possible triangles as well as to create situations where a triangle was impossible. When I realised that they have pretty much found all the possibilities, we recorded our results as a group. As I wrote these down, some students were able to explain why one triangle had the largest perimeter and another had the least perimeter. Some also made the point that some sticks didn't form a triangle so I gave them some time to think about why this was:
This is getting at a big math concept which I think often is not mentioned: the triangle inequality i.e. that two sides of a triangle always sum to more than the third side. Having the sticks in front of them made it easier for me to show them why this is true. Now some students had earlier tried using four sticks to create a triangle so I gave them one final challenge:
Create a rectangle with all five sticks and find its perimeter.
Most were able to do this but in the future, I would make it more accessible by asking them to create any shape using all five sticks and to work out its perimeter.
I was really pleased how well the students took to this. It is so important that they have this CONCRETE understanding of what perimeter is before they move on to more diagrammatic and abstract questions and, hopefully, will help them avoid misconceptions as outlined in this earlier post.


