Showing posts with label Handling Data. Show all posts

Tuesday, September 2, 2025

What Do You Notice with Google Trends?

For the first lesson of any semester, I ask students to complete this sentence: 

Math is the study of...

I get a variety of responses with the most common one being 'numbers' although 'logic' and 'solving problems' often get mentioned. I then tell the students that: 

Math is the study of patterns.

I give examples of how it is sometimes patterns in number, or patterns in algebra, or patterns in shapes. I then say that it is sometimes patterns in data. Today, I showed students this image. I explained that I had typed in a phrase to Google Trends which then produced this graph to show how often people had searched that term since 2004. I then asked them to discuss the graph in pairs and to think about what they noticed:

Moving around the room, I could hear lots of students noticing that there were big spikes in the data at regular intervals. A lot of students surmised, correctly, that this spike was an annual occurrence. Some noticed that the biggest spike occurred in 2020. Others wondered what the numbers on the y-axis represented (they represent relative interest over time). Others wondered at what time of year the spikes occur. It is difficult to judge the exact month on this graph but as I was able to access the original graph on the Google Trends site, I could tell them that the large spikes occurred each August. One student noticed another almost imperceptible spike each year and I confirmed that this was each January. 

I then gave the class a minute to think about what phrase could produce data with this distinctive pattern. Some wondered if it could be connected to holidays but most suggested that it might be something to do with schools. In fact, the phrase that I used was 'Back to school'!

One student made a suggestion though that I wanted to explore further. He thought it might be something to do with allergies. Realising that there might be seasonal spikes for this search term, I thought it would be good to generate the graph there and then, and these are the two graphs superimposed:

We noticed that the pattern in this data is similar in that there is an annual spike but it is not as pronounced as the 'back to school' data. We also noticed the spikes are earlier than the 'back to school' data and that there was another small rise later in the year. Looking more closely, I could confirm that these spikes were in May and September: "Pollen season!" one student exclaimed!
It was a nice way to get all students to value and share their own thoughts and I was glad that I charted one student's suggestion to show how it was the similar and how it was different to the original data.


Thursday, January 19, 2017

The best laid plans...often go awry.

With Burns Night fast approaching, I was reminded of one of his more memorable couplets last week: 
"The best laid schemes o' mice an' men
Gang aft a-gley."
I was in a Grade 5/6 class who had been learning about mean, median and mode. THey were able to tell me what each of these meant: the mode is the most common value; the median represents the middle value; the mean is the sum of all the values divided by the number of values. Some were unsure what the mean actually represented so I showed them concretely how it is an evening out of all the values as shown in this post.
I then gave each pair of students ten random playing cards and asked them to find the mean, median and mode for their set of ten values (we agreed that jacks, queens and kings count as 10). By giving them cards, it encouraged them to put them in order first (a step sometimes overlooked when calculating the median).


With ten cards, it allowed them to pull out the middle pair and use these to work out the median. Also, to work out the mean involved them practising their mental arithmetic (adding numbers and dividing by ten). When each pair finished, I gave them a new set of ten cards. It was a neat activity that was easy to organise and kept them engaged.
As they were doing so well, I decided to give a more challenging question: 

Find a set of ten cards that has a mode of 5, a median of 7 and a mean of 8. 

Before you read any more, try this one for yourself.


I have given questions like this before, and although I hadn't actually tried this particularly combination of numbers, I figured that there would be a few solutions. The students got stuck into it right away and as I moved around the room, I heard lots of great reasoning:
"The cards have to add up to 80!"
"Make sure we have more 5s than any other card."
"If 6 and 8 are the middle pair, then the median MUST be 7!"
When necessary, students would come to me to exchange some of their existing ten cards for ones that they needed. If a pair thought they had a solution they would show me and had to verify it worked:
In this case, whilst they have the correct mode and median, the mean is not 8. Back to the drawing board in this case. 
There was lots of great thinking happening but after a while I was surprised that not one pair had found a solution. This had me wondering: had given them an impossible problem? I had picked those values on the spur of the moment thinking that there would be a solution but now I was not so sure.
So with just a few minutes of the class left, I asked them to stop and pointed out that whilst there was great math happening, we still didn't have a solution: why was this? A few students asked if it was impossible. So as class we decided to see if we could reason our way through this. We agreed that we needed to get ten cards:
...and that at least two of these cards need to be 5s:
...and that the middle pair had to be something like 6 and 8 (i.e. have a sum of 14) to give a median of 7. Some students argued that you could have two 7s as the middle pair but only if you add an extra 5 to make this the unique mode:
So far we have 4 cards totalling 24. The remaining 5 cards must add to 56 if we are to get a mean of 8. Four of these cards must be (in the case above) greater than 8 and two must be (in this case) less than or equal to 6. Now the students were quick to reason that this could not be done: the four cards greater than 8 can have a maximum value of 40 and the remaining two cards can have a maximum value of 11 (if 5 is to be the unique mode). So as we cannot get a total of 80 with these cards, we cannot get a mean of 8.
The question was impossible to solve.
This is not what I had planned!
And yet, it worked really well. The students learned as much (if not more) from proving that this was impossible than they did from finding the mean, median and mode of a given set of numbers. 
James Tanton refers to the importance of giving learners the opportunity to experience 'funstration' in Math. In other words, making sure they get engaging problems in which they will hit roadblocks. Impossible problems (e.g draw a quadrilateral with 4 acute angles; find a number whose square is bigger than 5 but whose square root is less than 1; draw a triangle with lengths 4cm, 5cm and 10cm) are one way of doing this and this is why I like giving them occasionally.
Even when I hadn't planned to!
*          *          *
Note: the proof outlined above does not contain all the arguments and cases that the students thought about and as such isn't necessarily complete. Can you improve upon it?


Monday, June 2, 2014

Always True/ Sometimes True/ Never True

I was reminded about how much I love this question today when I took part in a crowdsourcing of questions courtesy of Tracy Zager (@TracyZager) via Twitter and Google docs. I have given this type of questions to students from all grades  (K to 12) and what is great is that it gets them reasoning and proving from a very early age. Consider the following:

Addition makes a number bigger
 
Most students (especially in the primary, junior grades) will say 'Always true' and back it up with examples. Yet there will be some who wonder about what happens when you add zero? Does this make the number bigger? And intermediate students will then begin to reason that adding a negative number actually makes the number smaller. So the answer is 'Sometimes true'
Sometimes a question helps them broaden their understanding of math terminology:

Two identical triangles can be put together to make a parallelogram

I know some students will say 'Sometimes true' offering the case where two right-angled isosceles triangles join to make a square (in green below) which, they think, is not a parallelogram. Others might make what they think is a more obvious parallelogram (in blue below).
This gives us a great opportunity to learn why all squares are parallelograms (quadrilaterals with two pairs of parallel sides). This leads into an understanding of why the area of a triangle (½×base×height) is simply half the area of a parallelogram (base×height)

Perhaps my two favourite questions I got today were:
A solid that has a square shadow is a cube
A solid that has a circular shadow is a sphere
 
It immediately got me thinking about other solids that might have these shadows. Or what about if I reverse the order of each statement?:
A cube has a square shadow
A sphere has a circular shadow

So here, for your delight, are some other Always true/Sometimes true/ Never true questions:

  • A rectangle is a square
  • When you cut a piece off a shape, you reduce its area
  • When you cut a piece off a shape, you reduce its perimeter
  • Bigger objects are heavier than smaller ones
  • The diagonals of a parallelogram are unequal in length
  • Multiplication makes numbers bigger
  • Division makes numbers smaller
  • The sum of four consecutive numbers is a multiple of 4
  • The sum of three consecutive numbers is a multiple of 3
  • The more you roll a dice, the more likely you are to get a 6.
  • The sum of two odd numbers is an odd number
  • The product of an even number and an odd number is an odd number.

Monday, March 3, 2014

Spatial Reasoning

I was at a Ministry-run conference last week working with other Math-folk from all over Ontario and suddenly had an epiphany regarding Spatial Reasoning. To try and understand what Spatial Reasoning is, have a look at this video and predict which of the five squares below the paper will look like when it is unfolded:


I haven't come across a precise definition of what Spatial Reasoning is but in general, most folk agree that it involves visualising, perspective taking, mental transformations, composing and decomposing (shapes, numbers, measurements, data, and algebraic expressions). Nora S. Newcombe in this excellent article says 'Spatial thinking concerns the locations of objects, their shapes, their relations to each other, and the paths they take as they move.' She goes on to show how Spatial Reasoning is not a 'learning style'  but a habit of thinking, that for anyone it can be improved, that whilst there may be gender differences, the important fact is not the causation of these differences but that both genders can still improve their Spatial Reasoning.

My big lightbulb moment was when I realised that Spatial Reasoning is so much more than geometry. Indeed it transcends Math. It is a way of thinking that helps us solve problems in number, measurement, algebra, geometry and data handling; in science (figuring how the atoms in a molecule are arranged); in technology (any work on perspective or visualising how to build a certain structure); in sports (reading the shape of an opponent's defence or making a 'no-look' pass); in the arts (seeing the sculpture in a block of marble or the visualising of dance moves that a choreographer must make; in geography (any map making or map reading activities); in history (visualising what a building must look like from the clues found in an archaeological dig).
This got me wondering, though, how aware are we as teachers of Spatial Reasoning and much time do we spend on it? Working with some colleagues at my table we quickly came up with the following ideas just in Maths:

Primary:
  • Use positional language as much as possible
  • I'm thinking of a shape that looks like a triangle and a rectangle stuck together. Draw what it might be.
  • There is a shape in this bag. Feel it but don't look at it. Now tell me what you think it is.
  • Imagine holding a can of soup. How many circles might you see?
  • I have a letter. When I turn it upside down, it still looks the same, What might it be? What couldn't it be?
  • You measured the table width with your pencil and it was 10 wide. My pencil is twice as big as yours. In your head, imagine me measuring the width. Would I use more, less or the same as your pencil?
Junior:
  • I have two rectangles and put them together. What shape could I end up with?
  • I cut of the corner of a square. Use a geoboard to show the shape I cut off and the shape that I'm left with.
  • I have joined 6 cubes together. From the front, they look like an I. From the side, they look like a T. What do they look like from above?
  • Visualising the mean as an evening out of all the scores as shown in this post.
  • Visualise two congruent triangles. How could you arrange them to make a parallelogram? How does this help us get a formula for the area of a triangle?
Intermediate:
  • Imagine two congruent trapezoids. How could you arrange them to make a parallelogram? How does this help us get a formula for the area of a trapezoid?
  • Imagine unfolding a cylinder. What shapes will you see? How would you work out the area of these shapes.
  • Imagine two lines. One crosses at (-4, 0) and (0,4). The other crosses at (0,-2)  and (2,0). How would these lines look?
  • Imagine completing the square like this
Senior:
  • I have a function that has four roots and a range y<4. What could my function be?
  • Imagine you slice a cone. What are the different shapes that the cross-section could be?
  • Imagine you have three different planes. How many different ways could they intersect?
  • How many zeroes are at the end of 125!
  • What happens to the secant through two points in a curve as the first point gets closer to the second?

In fact, I will go so far to say that visualising techniques (far more so than rote memory of rules and formulae) are essential in understanding calculus.

After the session, I engaged in a wonderful Twitter dialogue with Malke Rosenfeld who is also learning about the importance of Spatial Reasoning. I highly recommend her blog here.

And as for the solution to the paper folding exercise? Check below!


Monday, January 20, 2014

Making Predictions

Here in Ontario, we have had some very cold and snowy weather recently. I took advantage of this in a Grade 5 class to see if the students could make predictions using line graphs. Getting students to predict what graphs look like is, in my opinion, as important as getting students to draw graphs from given data: it gets students reasoning, proving and reflecting.
Before going further, a little geography might be in order:
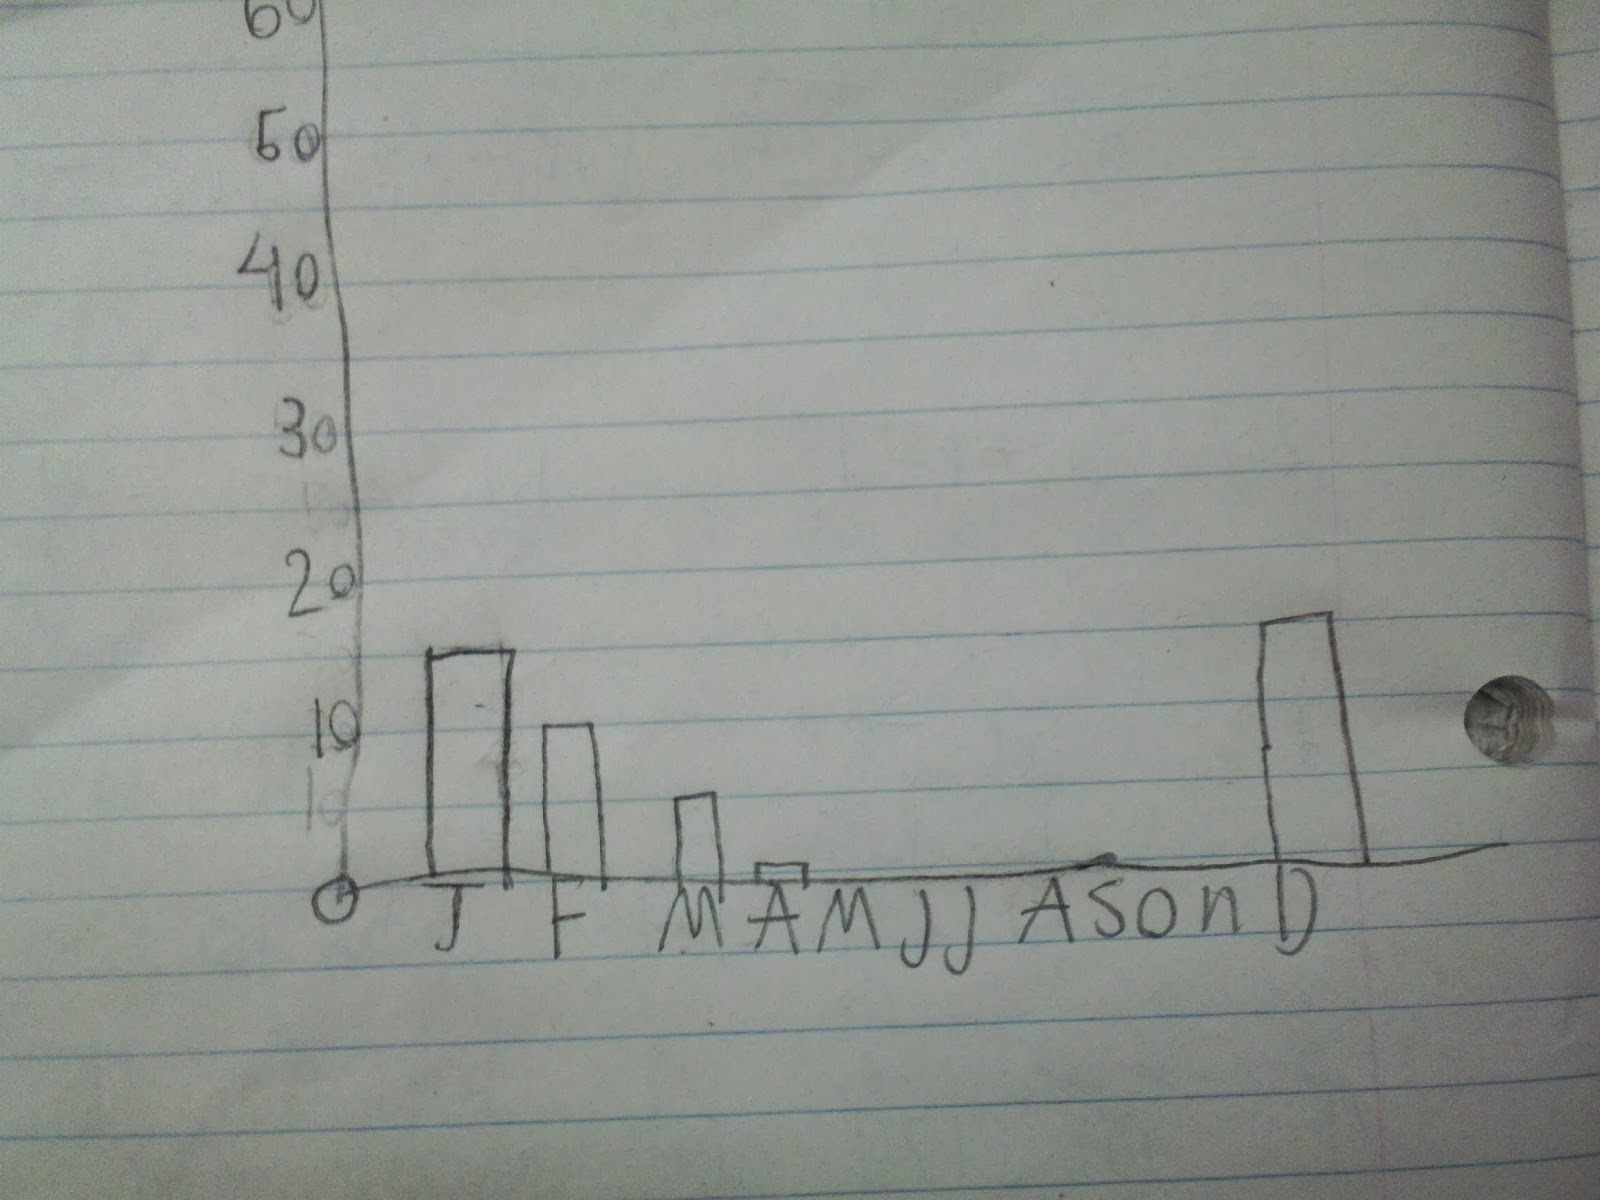
We asked students to draw a graph to predict what they thought the average snowfall per month in Toronto would be. A set of axes was drawn on the board to anchor everyone to the same scale. Initially some drew bar graphs, some vertical line graphs and some broken line graphs. As our goal was interpreting line graphs, we asked students to redraw (if necessary) their graphs so that it was a line graph. This is the sort of thing we saw:


We could then ask the students one of my favourite questions:
Look at your graphs: What is the same? What is different? 

We then showed them the actual graph from  a really neat site called CityStats.ca:

There were some great conversations about how close their graphs were to the actual graph, even though they did not have access to the primary data. Also there was great discussion about the red line, what it meant and how it looks as if Toronto gets less snow than the Canadian average.
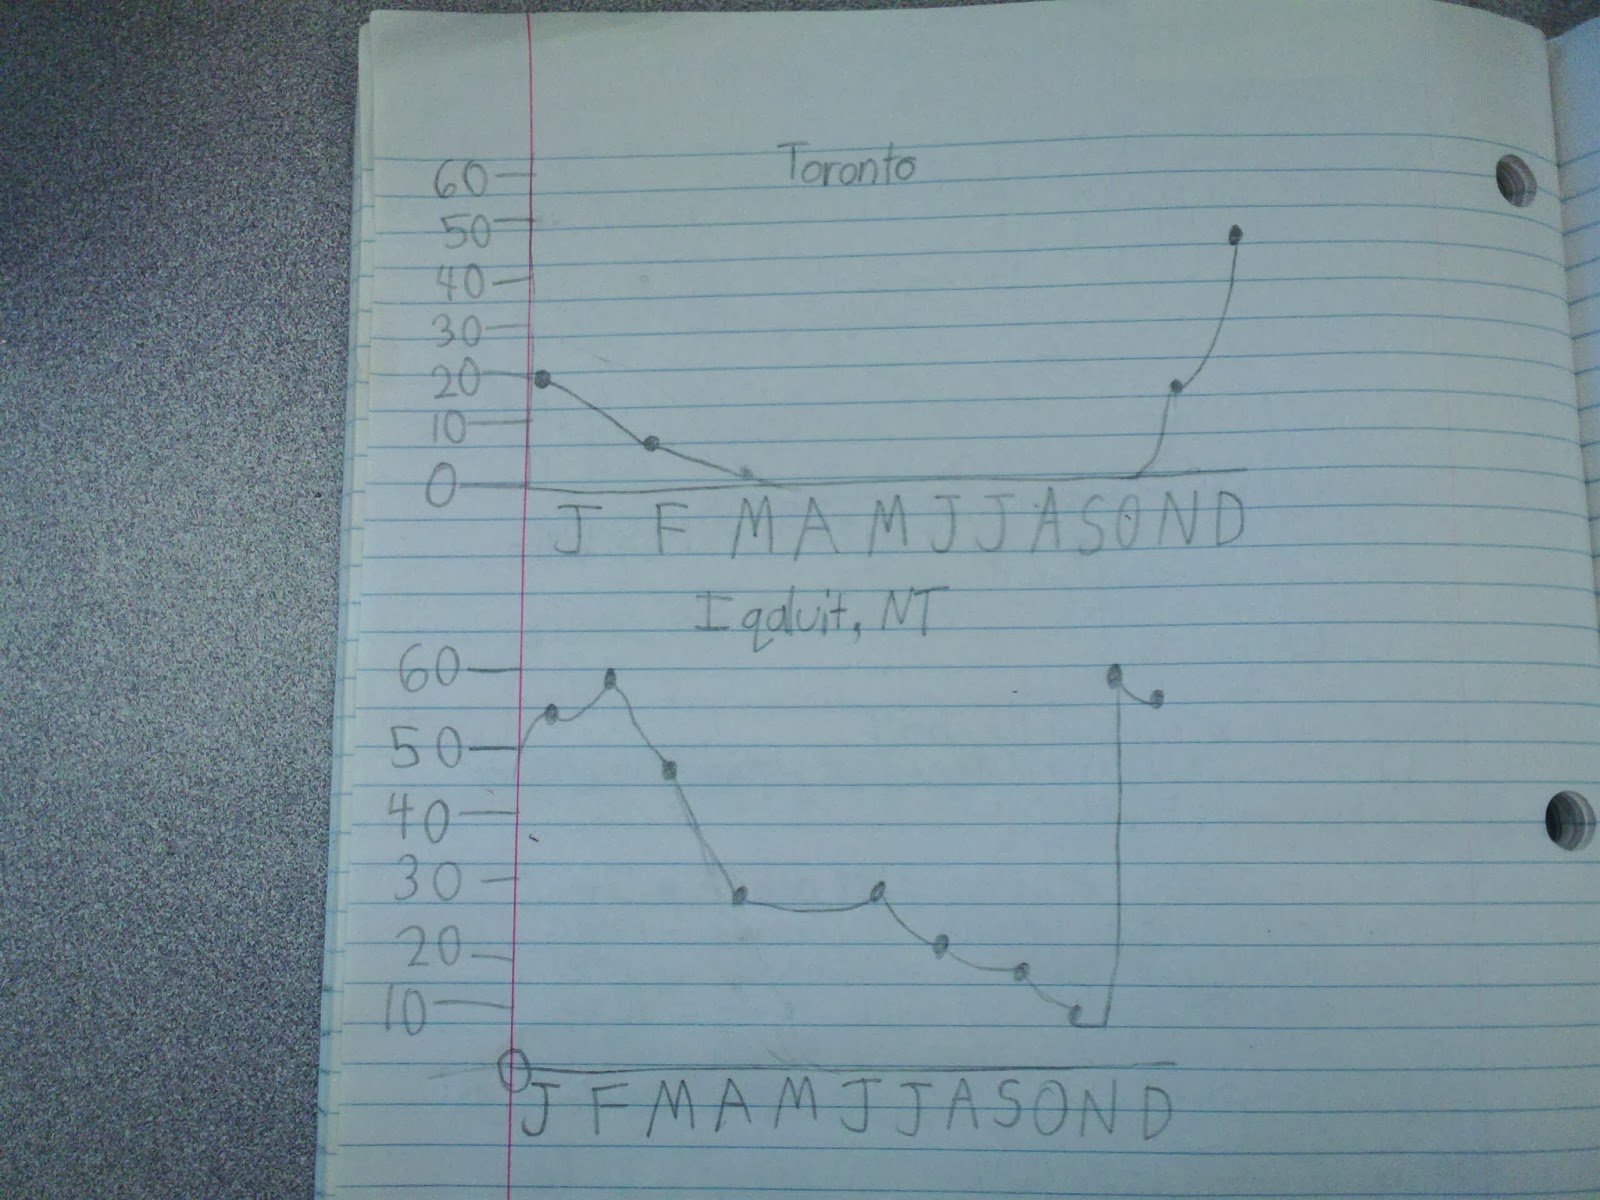
So we then asked them to predict what the graph for Iqaluit would look like (Iqaluit, the capital of Nunavut, is in the far north of Canada). What we saw was a graph similar to Toronto's but shifted upwards:


We then showed them the CityStats graph for Iqaluit...

... and it was neat to see everyone reflect that their answer was wrong (and they were OK with that) but to then think of reasons why that might be. Superimposing the two graphs we noticed a curious thing:

Iqaluit gets less snow than Toronto in the winter months!
This was a big surprise to all the students (and most of the adults). Various reasons were suggested as to why this might be until one girl said "Well in Science we've been learning about the water cycle and because it is so cold in Iqaluit, all the water will be frozen and so there will be not as much moisture in the air so there will be less snow". Now I'm not sure if this is the exact scientific reason, but it was a very impressive hypothesis!
And a lot better than my 'It's too cold to snow' excuse.

Thursday, October 10, 2013

How are you feeling? Average? Or just mean?

If I ask someone how they are feeling and they reply "Oh, average" it is sometimes very difficult for me not to say "Oh, and what sort of average would that be then? Mean? Median? Or mode?" For the record, I do (mostly) refrain from such a comment but it does get me thinking how misunderstood the idea of average is. For example, if I asked you to work out the average of my (ahem) Math Test marks below:
85, 81, 84, 87, 89
...I would imagine that most people would work out the mean and not the median, and I would be very surprised if anyone would work out the mode (and to be honest, why would you with this set of data?) I would also suspect that for those who work out the mean, a majority would do so by adding up the scores and then dividing by 5. With this set of data though, my first instinct is to look at the numbers and think '85 is in the middle of these, so I wonder if I can adjust the other numbers to get as close to 85 as possible?'
I could do this as follows:
Take 4 from the 89 and add it to the 81 so I now have:
85, 85, 84, 87, 85
Now I can take one from the 87 and add it to the 84 to get:
85, 85, 85, 86, 85
Now I can see the extra one on the 86 can be split nicely between the 5 scores:
85.2, 85.2, 85.2, 85.2, 85.2
So I know my mean score is 85.2 and I can do this quickly (without any need for calculations) because I know that the mean is, in effect, the levelling of the scores. This point is often not understood by students even if they have learned the 'add all the scores and divide by the number of scores' formula.
So how can we get students to think of the mean like this? Well suppose a quick survey was done on the number of siblings that six students have and we get the following data: 2, 3, 1, 4, 1, 1. We could represent this as follows:
 If we see that we have some scores above 2:
...and then level these out:
then we see that the mean number of siblings (as opposed to the number of mean siblings) is 2.
Now I'm not saying that the mean should be worked out like this every single time but I certainly believe that all students should understand that this is what the mean does.
And this is not just a notion that is helpful in elementary schools. Earlier this year I was working on a Calculus problem as part of my Masters in Mathematics teaching at the University of Waterloo. I had to find the mean width of a semi-circle with radius 1. There is a quite amazing formula (below) that can be used to find this out but I didn't need it.
 
I relied on the approach above. Knowing that the semi-circle will have an area of Ï€r²/2 or simply Ï€/2, I realised that to find the mean width I just had to adjust the semi-circle to a rectangle of length 2 with the same area as the semi-circle and from here find out its width.


For good problem solving questions that require students to apply their understanding of the mean, you should look at the University of Waterloo Math Contest site. The one below is from the 2013 Grade 9 Pascal contest.


Friday, April 19, 2013

What are the chances?

This past week I was in a couple of different Grade 6 classes doing some probability tasks. Watching the kids tackle these led to some huge insights as to what they actually are thinking when they do probability questions. It got us as teachers thinking if students make mistakes in a probability task, is the misconception to do with the concepts of chance or the concepts of number sense.
But the only way we could get these insights was by listening to the kids' conversations!
So here is the first question we tried, and the first misconception...
To be honest, you can see this student's point! The middle bag has a circle close to the top so that's the one to choose if you want to get a circle... just make sure you pick the top shape (especially if it  feels round!) This got me thinking that the question will be better if I use the same shape with different colours (e.g. just black and white circles). Anyway we addressed this misconception by putting some shapes in a bag and shaking them up and down and asking "Do you know where the shapes are now?" It did the trick!
The more common misconception though showed that the kids were thinking additively and not proportionally.
Essentially what this student (and some others) were saying was 'Since the first bag has the least number of squares, you are less likely to pick a square... therefore you are more likely to pick a circle.' Conversely, there were other students who picked the third bag as it had more circles. The interesting thing was that when we asked the students to write the probability of getting a circle they were good at this: most were able to say 2/5, 6/15, and 10/25. So they might have understood the chance of getting a circle but they misunderstood the concept of equivalence. We challenged these ideas by representing the fractions using a virtual manipulative:
It was clear that students will still need to see concrete representations of fractions for them to move from additive thinkers to proportional reasoners.
We then stumbled across another misconception; we asked students what will happen if they flip a coin. They wrote their answers on post-it notes which allowed us to quickly display the results:
 
Here, the majority of students don't clearly understand chance. Some students thought that if you begin with the heads 'up' then it will land heads 'up'! Of course, we tested these ideas straight away.
What was also apparent was that if students only ever experience situations in which all the possible outcomes are equally likely then they might that in every situation, every possible situation is equally likely. Here is the second question we tried (in a different class):


We know that some students have the misconception that as there are three outcomes (i.e. you could pick a green, a yellow, or a blue) each one is equally likely. Again, a quick experiment usually is enough to challenge such notions. Or, in this case, say (as my colleague Chad did) "How about we play a game; every time a yellow is drawn, you give me $10 and every time a blue is drawn, I give you $10." They don't usually want to put their money where their mouths are!
Students began by representing their ideas with tiles as shown:

They could even write the probabilities correctly:
 However they had the misconception that another yellow was being added, the probability was increasing. In other words they couldn't see that the original 4/8 probability was the same as the final 5/10 probability. We asked them to think of how they could use the tiles to convince us that in fact 5/10 was larger than 4/8 (rather than us show them that in fact they are equivalent). Light bulbs began to go on when they used representations such as these:
We also showed equivalence using the virtual manipulatives above for further proof (always a good thing).
 
So for students to experience success in probability we concluded that they must have the opportunity to use represent it in a variety of ways (e.g. spinners, tiles, number lines etc.) The nlvm site has a superb applet for spinners by the way in which you can design your own spinner and have it spun for up to a thousand spins and have the results displayed in a live bar graph.. Here is one such bar graph which begs the question 'What did the spinner look like?'
But we also wondered if students would also improve their understanding of probability by playing board games, card games, and dice games like Yahtzee. Maybe this could be the perfect homework assignment!


Thursday, January 31, 2013

Now That's What I Call Feedback

I am slowly but surely working my way through James Joyce's Ulysses (my goal is to finish reading it before the summer!). I find the whole stream-of-consciousness technique fascinating (if at times confusing). Today I was in a Grade 6 class and I was suddenly reminded of Ulysses when we used TodaysMeet and saw the stream-of-consciousness of the students.
The students had been working on probability so we asked them this question:

In this can, there are between 10 and 30 cubes. A third of them are blue. What could be in the can?

This is what was in the can:
What followed blew us away. The class had a set of iPads and the students began posting their solutions immediately.
Or their questions.
Or their revised solutions.
Or advice for other students.
Or requests for help.
As a teacher I could see who needed help just be looking at the feed on TodaysMeet. This stream-of-consciousness eventually ran to over 27 pages! Below is just a sample of what was going on. As you read through it, see if you can link all the conversations.


 Isn't all that feedback just wonderful? It was fantastic to see students not being afraid to say if they are stuck and ask questions and other students helping them and sharing ideas. At this point we gave them some additional info. We told them that there were just two colours, blue and green, and that there were between 10 and 20 cubes (not 10 and 30). This really caused problems for some students:


Yes, some students did get stuck but there was so much feedback available that they overcame these difficulties:


Some used blocks to help their thinking:

At this point we asked the class for all the possible solutions. They told us that you could have A) 4 blue and 8 green, B) 5 blue and 10 green, or C) 6 blue and 12 green. What really pleased us is how they were able to reason why these were the only possible solutions (e.g. because these are the only totals between 10 and 20 that are multiples of 3). 
We then gave them one final piece of info: the total number of  cubes was odd. They then had to vote on what was in the can based on A, B, or C as detailed above:

We were pretty chuffed to see someone reason so clearly here!
At this point we wanted to know what students thought of the whole experience. Dave, the classroom teacher, reminded them that we were looking for descriptive feedback. This is what we got. Then picture the smiles on our faces.


So if this the richness in thinking that is potentially there, can you imagine what a disservice is done when students are asked to simply copy a note? In silence?
The final say goes to this student who summed up how we all felt today:
Hooray indeed.
                                    *                                           *                                           *
TodaysMeet can be found here: http://todaysmeet.com/