Showing posts with label Miscellaneous. Show all posts

Friday, February 10, 2023

Incorporating Indigenous Ways of Knowing Into Math

I recently spent two thought-provoking days at the Ontario Mathematics Co-ordinators Association's annual conference. The theme was on how we can explore mathematics through Indigenous knowledge systems and our two featured speakers were Isaac Murdoch and Jodie Williams. As often is the case with these conferences, I left with a head overfull of new ideas and thoughts that I needed to order and condense so that I might have a better chance to actually incorporate my new learning. Three things in particular stood out for me:


1) The Importance of Learning from the Land

Whether it was the Egyptians who needed to develop ways of measuring the agriculturally-rich land around the Nile fairly or the Polynesians who learned incredibly sophisticated ways of measuring astral movements and using these to navigate thousands of miles across the Pacific Ocean, so many areas of math originated from a need to understand the world around us. Isaac is a great story-teller and as I listened to his many experiences of learning off the land (navigating his way out of the bush, thinking for a long time about how he was to go about building a birchbark canoe, using the stars of the Plough to help in the design of a lodge), something suddenly dawned on me:

The land is a perfect place to develop and nurture curiosity. And curiosity (which I would think is a transferrable skill) is essential to mathematics.

When we immerse ourselves in the land, we begin to notice and wonder:

  • why does moss tend to grow on one side of trees?
  • why do the branches of some trees grow longer on one side?
  • why do certain plants flourish on one side of my garden and not the other?
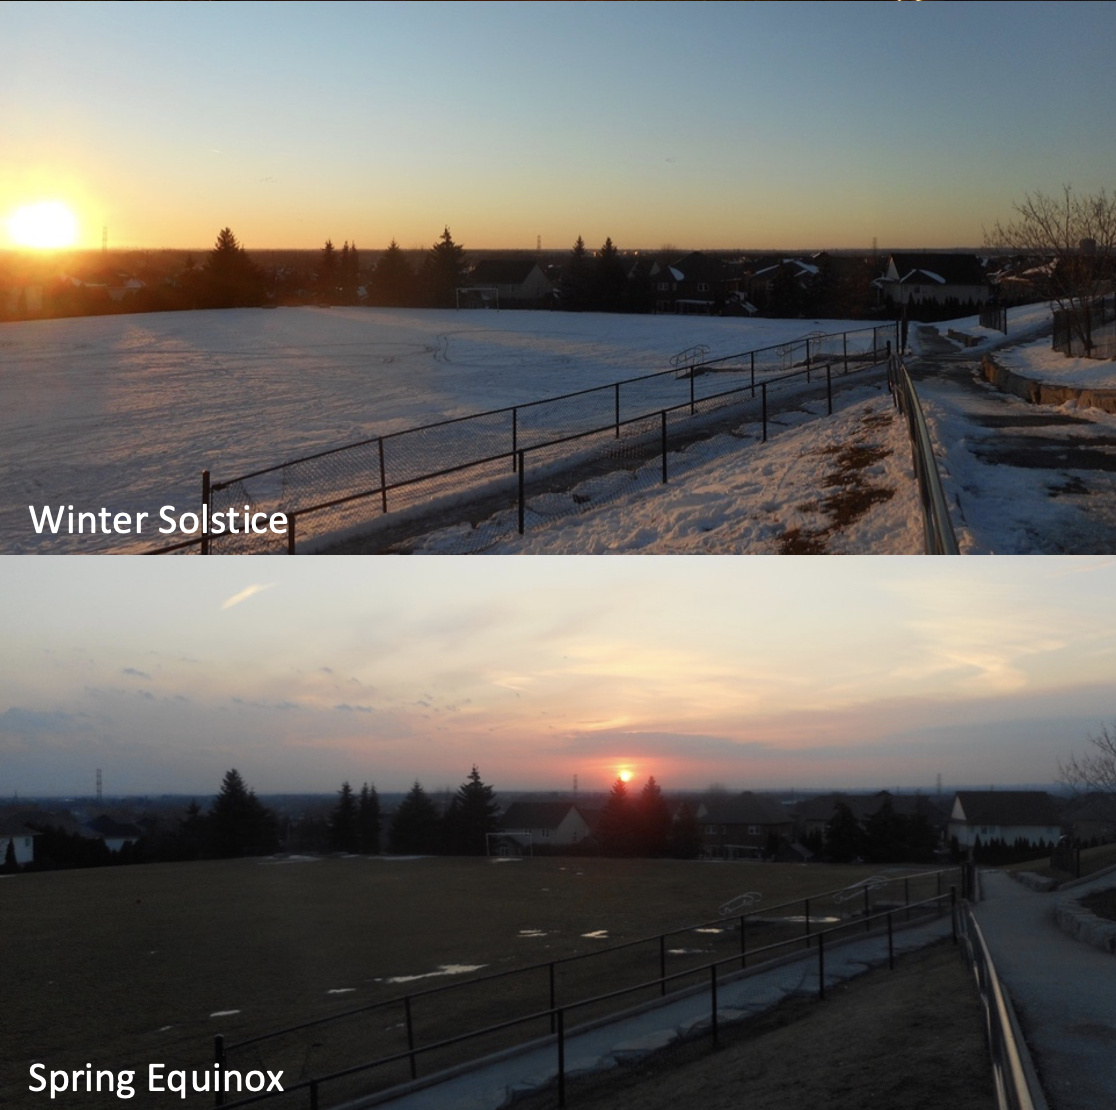
  • is it true that the sun always sets in the west? 


All these noticings and wonderings are a precursor to a desire to understand different relationships, or to help see patterns. These are important mathematical traits.
2) The Importance of Physical Objects

Isaac also shared the importance of story-telling and how certain physical objects are used as a powerful aide-memoire. For example, the beads that were intricately arranged to form a necklace also revealed a family tree. Similarly the carvings on Isaac's memory stick each had immense significance such that you could sense the memories flowing through him as he held it.

It got me thinking about the tactile nature of such objects and how these are an essential part of learning and understanding math. I have written many times about the importance of the Concrete-Diagrammatic-Symbolic continuum and how often in math, we do our students a disservice if we jump to symbolic without giving them enough concrete or diagrammatic experience. This was most recently made clear when I saw students make good use of algebra tiles to multiply binomials.


I wonder how much students have missed out on these concrete experiences (especially in Math) when they were learning online and how much they would benefit from it now.

3) The Importance of Incorporating Indigenous Knowledge Systems into our Pedagogy

One of the important changes to the new Grade 9 de-streamed math course is the inclusion of how math has historically developed across all cultures. Representation matters, and if our students can see how their culture helped in the development of Math, then they will be more likely to see themselves as mathematicians. Jodie explained how Indigenous knowledge systems are not about learning different math, but rethinking the way that we explore and demonstrate an understanding of the concepts: it's not what we teach but how we teach. In terms of re-thinking our pedagogy, Jodie encouraged us to think about how to make things more experiential. We could:

i) Start with an experience of doing

ii) Encourage students to share their learning as they experience the 'doing'

iii) Once students have become familiar with the experience, then teachers can bring in the math.

In many ways, I see similarities between these ideas and those of Peter Liljedahl's Thinking Classrooms. As such, I think that there are many math teachers here in Ontario who are walking down this path already. I also think that when we create lessons where, for example, we nudge students into developing a measurement formula, then we are also aligning with this pedagogy. My own personal experience is that this always leads to better learning.


I am grateful to OMCA for arranging this conference and to Isaac and Jodie for sharing their wisdom. 

Thursday, December 16, 2021

The 12 Days of Christmath: Day 12

 Here are the Day 12 puzzles for the 12 Days of Christmath challenge. Enjoy!!

Primary

Fill in the grid so that each row, each column and each  two-by-two square contains exactly one of each picture.


Primary (French)

Remplissez la grille pour que chaque rangée, chaque colonne et  chaque carré 2X2 contienne exactement une de chaque image.


Junior


Intermediate


Thursday, October 28, 2021

Coding in the New Grade 9 De-Streamed Math Course

 Coding is a new expectation in Ontario's Grade 9 De-Streamed math and is an area where a lot of my colleagues have asked for support and resources. Trying to figure out exactly is requires has been tricky: the MOE has yet to provide teacher supports in the form of examples, key concepts and sample tasks. However, my own sense is that there is a lot of good that can come when aim to use coding to intentionally learn about math concepts as opposed to coding things like Mario-type games. For this reason, I created a series of short Coding Challenges for the Grade 9 teachers to use with their classes and I have been in a number of schools trying these out.

Before I start any class, I ask what coding languages they have used before. The vast majority of students are familiar with Scratch (used mainly to create the aforementioned Mario-type games) but there is always a couple of students who have learned Python, Javascript or C++. I tell these students that although I will be showing the class a Scratch code, they are more than welcome to use the language of their choice to create a similar code on the condition that they explain this code to me later. 

I thought it would be good to get students to write some code that would produce a list of numbers as this is something that would tie in to some of the expectations from the Number strand. A nice introduction to each code is to provide a flowchart and ask the students to use this to write a list of numbers:

I'm quite happy to let the students struggle through this as their mistakes are often a result of not following the instructions precisely; this is something we need to bear in mind when we are coding!


After 10 minutes or so, we regroup and once we have agreed on how to follow a flowchart (and what numbers we should have written down), I give them a simple example of how this can be written using Scatch:
Care is needed her in building up the 3x+1 function: the same care that is need when using order of operations. This in itself is a worthwhile lesson. When students have successfully recreated this code, I ask them to alter it for these functions:
Now this code is something I produced and I am so far from being considered an expert coder, so I always can challenge students who have finished quickly to improve my code. One teacher noted that the output for the above code:
lacks a bit because it only gives the y-values, and that it would be better to see a pair of co-ordinates. I was initially unsure how to achieve this, but after watching what some students were trying, I came up with this:


Much better, I'm sure you would agree!

In a different class, students had already completed some of the coding challenges so we tried a different approach. We gave them the actual code and challenged them to follow this (instead of the flowchart) to create a list of numbers:
What I liked about this approach, is that we didn't have to spend time consolidating after they had written their answers: we simply asked them to recreate the code and see what the output is (in this case it is the... well, that would be telling wouldn't it?!) The students were then able to make sense of the code (especially the last two lines).
My challenge for this code was to improve it so that the user can choose the first two numbers (as opposed to starting with 1 and 1). It isn't long before students come up with something like this:

Now I can ask one of my favourite questions: 
Choose two starting numbers that will give you 1000 for the twelfth term.
As students work their way through this, some good questions come up:
  • are there any whole number solutions?
  • if you are using decimals, how close can you get?
  • how can you be more efficient in your search?
One student really took this last idea to hand. By fixing the first two numbers to be the same, he created a code that checked every possibility starting from ) 0.0001:


In another class, we started by giving them the flowchart for the wonderful Hailstones Numbers:
As students worked through this, some questions quickly emerged:


  • is there a number which doesn't lead to a 4-2-1 loop?
  • is there a different loop that a number can get caught in?
  • what is the longest amount of numbers that can be written before getting caught in a loop?
In this class, the teacher had been getting the students to write the Scratch code on their own and only showing them my code if absolutely necessary, so this is what we did for the Hailstone numbers. One challenge here is how to code the bit where we have to check to see if a number is even or odd. This necessitated a little interlude on modular arithmetic and 'if.. then...else' statements, but eventually led to this code:
On a side note, one particular student needed some extra examples to help him understand mod arithmetic but when the penny dropped, he declared with a massive smile: 'Mod arithmetic is really cool!'
As students used their code, they surmised that it would appear that every number gets stuck in the 4-2-1 loop. I challenged them to change their code so that the list stops at the first instance of 4-2-1 and tells us the length of this list. One student came up with this:

This is his explanation of the code:

We ended the class by relating the story of Fermat's Last Theorem and how this easy-to-understand problem eluded proof for centuries until Andrew Wiles heard about in a school math class and then devoted himself to this proof which he eventually achieved after 7 painstaking years. I then told them that Hailstone numbers are also referred to as the Collatz Conjecture and whilst mathematicians think that all numbers end in the 4-2-1 loop, no-one has actually proved this. 
'Maybe one of you here is inspired by this story, like Andrew Wiles was inspired by Fermat's Last Theorem. And maybe one of you will, years from now, create a beautiful proof for this and claim the $1 000 000 prize for doing so.' 
This got them excited!
'If so,' I continued, 'Don't forget to seek us out and at least buy us a cup of coffee!'

*        *        *
Personally, I have learned the following:
  • Coding can be a really great way to explore many math ideas that are in the new curriculum and it can be done in a way that doesn't feel like an addition. 
  • Have the students work with a coding buddy: shared thinking (even shared devices) lead to stronger learning.
  • Have some extension questions ready to go for those that finish quickly, and don't feel that you need to have the answers to these: trust the students to find a way and be happy to learn from them.
  • Be happy sharing your mistakes with the students, and show students how you talk through your thinking when de-bugging this mistake.


Thursday, November 5, 2020

The Big Ideas of Trigonometry (2)

In order to consolidate what they had previously explored on sinusoidal graphs, we gave the students the Marbleslides Periodics activity. Half of our students were with us and the other half joined us via Zoom (their teacher provided them with the class code). 

Engagement was not a problem: all students got stuck into the tasks straight away and we could use the teacher dashboard to see which students needed prompts and which ones did not. If a student at home needed the prompt, the teacher sometimes did this quickly through Zoom.


We had set the activity up so that we were both co-teachers which meant either one of us could use the feedback button to give feedback to the students working at home.

In addition to the conversational and observational evidence that we were getting we could also use the students' responses to some of the 'Predict' questions (shown below) to provide feedback.


By using the 'Snapshots' tool, we could take some responses for a particular question and look at these with the whole class (those in the room and those working at home). We could then give feedback as to how we could improve these answers by using more precise mathematical terminology.

It was during the Challenge Slides that we really could see that the students had a solid understanding of sinusoidal graphs: conversations were littered with suggestions such as 'Change the amplitude', 'Shift it up', 'Change the b value and it will stretch the graph out'.
Challenge 4 was a sticking point though: 
Students had no problem getting a graph that went through the stars but with the marbles being dropped vertically from the point (0,12), they just settled in a dip without collecting any stars.
At this point, I was a bit stumped too so we stopped the class to try and think our way out of this. I made the point of telling the students that I was stuck and that this often happens when you do good problems. I wanted to model what I do when I get stuck so that they could develop these strategies too.
Firstly, we confirmed that we had pretty much exhausted all the potentially useful transformations.
Then we mused: why don't these work? We agreed that it was the position that the marbles were being dropped from. This of course begged the question: 'if we could change something, what would we change?'
Well, in this case we would like to change the position that the marbles are dropped from. I do confess that I did try to drag the launch point but to no avail!
So if we can't change the position of the drop, what else could we do?
Then the penny dropped (or rather, the marbles): We could divert the marbles.
How could we divert the marbles? With a second sinusoidal and by using domain restrictions!
I then noticed the instructions on the page:
In the rows below, type as many equations of periodic functions as you need to collect all the stars.
Well played, Desmos. Well played.
After a quick exchange of ideas as to what this second graph could look like, the students came up with some great solutions:

It is one thing to hear the cheers of the students in the class as they are successful at each challenge, but it is another thing when one of the students working at home sent this message via Zoom:


Of course, this is all very well but if the students are just being entertained by marbles sliding down ramps and collecting stars, does that actually mean they have learned anything?
After the lesson, the teacher stated quite simply this:
'They get it. They totally get it.'
'It' being the overall expectation we were focussed on:
Demonstrate an understanding of periodic relationships and sinusoidal functions, and make connections between the numerical, graphical, and algebraic representations of sinusoidal functions.
'I can give them all level fours get it and not worry about giving them a test.'
This was important: with face-to-face time at a premium, any time spent on tests takes away from this. There will be situations where a product (such as a quiz or a test) might be a better way to assess or evaluate our students, but my sense is that if we look more closely at our overall expectations, we will see that many of them lend themselves just as nicely to activities such as this where we can use our observations and conversations to assess and evaluate.
More importantly, the first line in Ontario's Growing Success document should be guide our assessment and evaluation practices:
'The primary purpose of assessment and evaluation is to improve student learning.'

Wednesday, November 4, 2020

The Big Ideas of Trigonometry (1)

Teachers around the world are facing many challenges as we get to grips with new schedules involving online learning, cohorts, quadmesters and even octomesters. For many, the reduction of face-to-face time with their students (the most valuable relationship) has teachers feeling increased pressures in effectively delivering any particular curriculum. I wonder if, now more than ever, we need to focus on the big mathematical ideas of each course.

Last week, I worked with a teacher of a Grade 11 class who were about to begin trigonometry. There are many specific expectations in the Ontario curriculum which (if you only see your students face-to-face for two or three mornings every two weeks) can be overwhelming: where to start?

Instead, we looked at one overall expectation:

Demonstrate an understanding of periodic relationships and sinusoidal functions, and make connections between the numerical, graphical, and algebraic representations of sinusoidal functions.

What activities could we give our students so that they could demonstrate an understanding of all of these especially given the scheduling constraints (a 2.5 hour lesson on Wednesday and Friday for one cohort and a 2.5 hour lesson on Thursday for the other cohort)?

For me it boiled down to this:

  • Mathematicians need to describe how things move in circular paths or behave in regular cycles.
  • The Unit Circle is key to understanding trigonometric ratios and can be connected to what they know about right-angled trigonometry.
  • The Unit Circle gives us the sine and cosine graphs, and we can see how these are connected.
  • We can transform these graphs in a number of ways similar to what we have learned with other functions.
These are the activities that we did and (spoiler alert) allowed the students to demonstrate their understanding.

1) Graphing Stories
As a minds on we gave them two videos from the excellent Graphing Stories site.
Plot the height of the waist above the ground:
The distance of the person on a roundabout from the camera: 

Both videos are by Adam Poetzel (Twitter: @adampoetzel).
I made sure that students had the chance to watch each video four times so as to allow them to improve their sketch graphs each time. Once we had done these, I could point out that straight line motion results in graphs with straight line segments. Circular motion, on the other hand, results in a wavy graph that repeats itself.
I could now tell the students that we were going to learn about the second type of graph.

2) Redefining Sine and Cosine
As an interlude, I asked them to write down a definition of what they understand 'sine' means. This puzzled them for a bit, so I rephrased it and said, 'Draw a right-angled triangle and use this to describe what we mean by the sine of an angle and the cosine of an angle'. 
This worked much better: they were confident in telling me that:

 sin θ=opp/hyp and  cos θ = adj/hyp.

This begged the question: what is the largest value that θ can have?
After a bit of debate, they agreed that θ had to be less than 90˚.
I told them that if this is the case, then our current definitions of sine and cosine would not help us with this triangle:

We could use the cosine law, of course, to find the missing side but this means that we have to find the cosine of 140˚. To do this we have to redefine the sine and cosine functions.

3) The Unit Circle
I used a Desmos graph to show the students what a unit circle and by seeing the right-angled triangle formed in the first quadrant, we can now define the cosine of an angle to be the x-coordinate associated with that point and that the sine of the angle is the y-coordinate of that point.


From here, we can see straight away the values for the sine and cosine of 0˚, 90˚, 180˚, 270˚ and 360˚.
The unit circle is a powerful mnemonic device so I recommended that they get used to sketching it!

 
4) Connecting the Unit Circle to the Graphs of Sine and Cosine
I asked the students to sketch a graph and plot the known values for sin θ between 0˚ and 720˚. They got something like this:

Now, it was a case of asking them to 'fill in the gaps' and sketch the complete graph. They all did this successfully and I reckon that the graphing stories they did earlier helped them see this. I did the same for the known values of cos θ between 0˚ and 720˚:

Again, they were successful. Now I could show them this lovely Desmos graph to confirm what they told me:


With these two graphs established, the students could tell me:
  • that the maximum and minimum values for sin θ and cos θ are 1 and ¯1.
  • that the cosine graph is just a sine graph shifted to the right (and vice versa)
  • that these neverending waves (which we can now call sinusoidal) are made up of repeating periods, and that the length of one of these periods is 360˚
5) Transforming Sinusoidal Graphs
Next, I grouped the students into threes and had them stand (socially distanced, of course) by a whiteboard, with each person having their own marker. They had downloaded Desmos on their own devices and I quickly showed them how to scale the axis so as to allow us to work in degrees.
Their task was to find out the effects of each of the following transformations:
  • y=sin x +c
  • y=a sin x
  • y=sin (x – d)
  • y=sin b x
Since they had already explored transformations of other functions, they were able to tell me what each of these effects were. With a bit of further provocation, they could tell me that the 'a' value gives us the amplitude of a sinusoidal graph (a measure of how 'tall' the waves are) whilst the 'b' value can be used to calculate the 'length' of one period of any wave.

I finished the lesson by asking them to make sure that they summarised what they had learned in a short note. I told them that this note would be useful in the next lesson when they would combine two or more of these transformations.
Afterwards, I chatted with the teacher and we both agreed that we were pretty convinced (through conversations and observations) that the students had a solid understanding of the overall expectation. The Desmos activity that I had planned for the next session would confirm for us how solid this understanding was.

Wednesday, October 25, 2017

Exploding Dots and Math Bumps

Last week saw the end of the first ever Global Math Week and what a successful week it was: over 2 million teachers and students took part! I am proud to have been an ambassador for this and to have brought the joy of exploding dots to many teachers and students. If you haven't heard about James Tanton's Exploding Dots then you need to check out this site. Basically, exploding dots are a way of visualising a journey of mathematical ideas from primary to senior grades.
In preparation for Global Math Week, my colleague, Dan Allen, and I held a number of sessions for interested teachers to introduce them to the idea of exploding dots and how they could incorporate this into one of their lessons that week:
For Global Math Week itself, I went into Grade 2, 3, 4, and 7 classes. The students really liked the idea that they were part of a worldwide event and that they were solving the same problems as students in Australia, China, India, Germany, Tanzania or wherever they had friends and relatives.
I started with simple 2 to 1 and 3 to 1 machines. Here, a grade 4 student is writing 7 using a 2 to 1 machine. Listen to all the kabooms happening in this clip:
We quickly learned that we can't use our normal number words to describe our results so instead of saying "One hundred eleven" we said "one, one, one". Then we used a 10 to 1 machine and found out that twenty-three could be written as...23! Here, I could explain to students that nearly all of the math they have learned so far has been in a 10 to 1 machine so in this case we could use our number words 'twenty three'. 
For the Grade 4 and 7 students, I then tried a 3 to 2 machine. 
Kabooms galore! It was neat to see the students taking care to make sure that they did the explosions correctly and checking with each other to see if they got the same result. Where they were discrepancies, they sought to convince each other of the correct answer. 
Finally for the Grade 7s, I tried an operation with them using a 3 to 1 machine:
This they did with no further instructions from me:
From a personal point of view, there is something about Exploding Dots that brings out a beauty I'd never considered in polynomial division. When Sunil Singh first introduced us to exploding dots last year, he challenged us to do 1÷(1–x) and 1÷(1-x^2) using this method. Even though I knew how to do these using more conventional methods, I was gobsmacked by the visuals produced:
I tweeted my excitement to James Tanton who then sent me another challenge. When I got stuck into this, something so surprising and wonderful happened, that I experienced what can only be described as 'Math Bumps':
Joyous maths indeed. 
My sincere thanks go to James Tanton and all at the Global Math Project for helping to spread joyous math everywhere.

Friday, June 23, 2017

Summer Math

With many students getting ready for the summer break, there are also many parents wondering how they can keep their sons' and daughters' entertained for six weeks and more. I am one of those parents! So here are some math-based ideas to try that are not only fun but will also help keep math skills honed until September.

Dice Games

Three words: Shut-the-Box. Farkle. Yahtzee.

OK, that might be five words but who's counting? These are great games for any age and are a wonderful way of getting students to practice their number sense. I particularly like Shut-the-Box: it is something I have played over a cup of tea with my children in a Tim Hortons.


Card Games
These can range from simple games like Snap, Pairs or Marilyn Burns's Oh No 99! game to more complicated games like Euchre and (my favourite) Cribbage. Playing these games necessarily involves using Math: from simple comparing of numbers (Snap) to more complicated decision making (in Cribbage, which of these two cards should I put in my opponent's box?)
You can also practice your math facts by playing a 'War' type game with cards. Split a pack of cards evenly between two people. Each player then simultaneously turns over the top card of their deck and places it on the table next to the other player's card. The first player to call out the total of the two cards gets to keep the cards. Keep playing until all the cards are used up. This game can be adapted so players have to get the product of the two cards, or to treat black cards as positive and red cards as negative and to get the total or product of these integers.


Spatial Reasoning Games
Math is more than number sense so it's important to work on our spatial reasoning. Kanoodle is probably one of the most engaging puzzles that I know of and has been a huge hit with any kid (and adult) that I've shared it with.


Other great games include Tantrix...

...and Pentago.

And if you want something for your tablet, I highly recommend the app Flow Free.


Puzzles
Try a yohaku puzzle each day!


For older students, try one of the many from the yohaku website or Twitter feed @yohakupuzzle. Or, if you have younger kids, create your own and leave them on the fridge!

I'd also recommend kakuro and KenKen puzzles. There is also the 100 Day Challenge at brilliant.org as well as the Math Before Bed site for younger kids.

Road Trip Math
If you are going on a road trip, then get your kids involved with this! Show them a map of your route. Better still, print off a copy of the map and mark on your location every hour and to note how many kilometres you have travelled: this might help kids answer their favourite question: "When are we going to get there?" Make a note of gas prices on your route: are they more expensive or less expensive than where you live? When you fill up with gas, mark the location on your map. How many litres did you pump in?  Using your map, how far do you think you will go before you need to fill up again.

Sporting Math
If your child  are following their favourite team, get them to collect data of how their team is doing. From simple bar charts to keep track of wins/losses to more detailed things such as number of runs/hits, batting averages etc. If you are watching a game or a sporting event, casually ask your children questions like:

  • By how many runs/goals/points are we winning?
  • How many runs/goals/points have been scored in total?
  • Have we had more running yards or passing yards?
  • How many minutes are left?

Or if you are going to watch the World Athletic championships in London, how about a question like "Who do you think will win: Bolt or De Grasse? By how much?"

BBQ Math
There are even opportunities to practice math when you are having a barbecue. From simple questions like "How many burgers are on the grill? How many will there be when I flip them over?" to using a meat thermometer to measure the temperature of the chicken breasts (we don't want to eat undercooked chicken, do we?!)

Hope that you have fun using these ideas!