Showing posts with label Concrete-Diagrammatic-Symbolic. Show all posts

Wednesday, November 5, 2025

The Sum of the First n Square Numbers

 One of the things I like to do as a teacher is provide visual proofs of why certain formulas work. A nice one that I use a lot in high school shows how to find the sum of the first n natural numbers:

I saw a method recently that shows a lovely visual approach to finding the sum of the first n square numbers and decided to share this with the students who come to our after school Math Contest Club. I use linking cubes to help me illustrate this.
First, I show them the sum of the first n square numbers and ask them to imagine that the last term is a general n by n square (and not a 3 by 3 square).

Then I make six copes of this sum:
Then I group them together: 
Then I get ready to put them together in two symmetric groups:
Then I join two of the sums together as shown to make an incomplete cuboid with a base of n by (n + 1):
Then I join the third sum to each of the blocks to create another incomplete cuboid with a height of (n+1):
Then I join these two blocks together to create a cuboid with dimensions n, (n+1) and (2n+1):

A simple division now allows me to get the sum of the first n square numbers:

This is a formula that I learnt to prove by induction but it is only when I have modelled it concretely that I fully understand why it works (especially the '2n+1' part and the '÷6' part).


Wednesday, November 22, 2023

A Visual Approach to Solving Linear Systems by Elimination

I've been lucky enough to work with a teacher of a Grade 10 Applied class and we have been trying to adopt a more visual approach to help students make sense of solving linear systems. We began by challenging students with this puzzle:

The students worked in groups of three on vertical whiteboards and they did a pretty good job of solving this by mainly using a guess-and-check approach. It was interesting that most focussed on the middle two equations first. It allowed me to tell them that we would now learn some cool techniques to solve this pair of equations (i.e. b – c = 5 and b + c = 19). As there were some magnetic algebra tiles handy I then created some zero pairs and asked them what the value of each was:
Now it might seem like an obvious question, but in particular I needed to be sure that they were good with the idea that when they see 3x and -3x (six things), they combine to give 0.
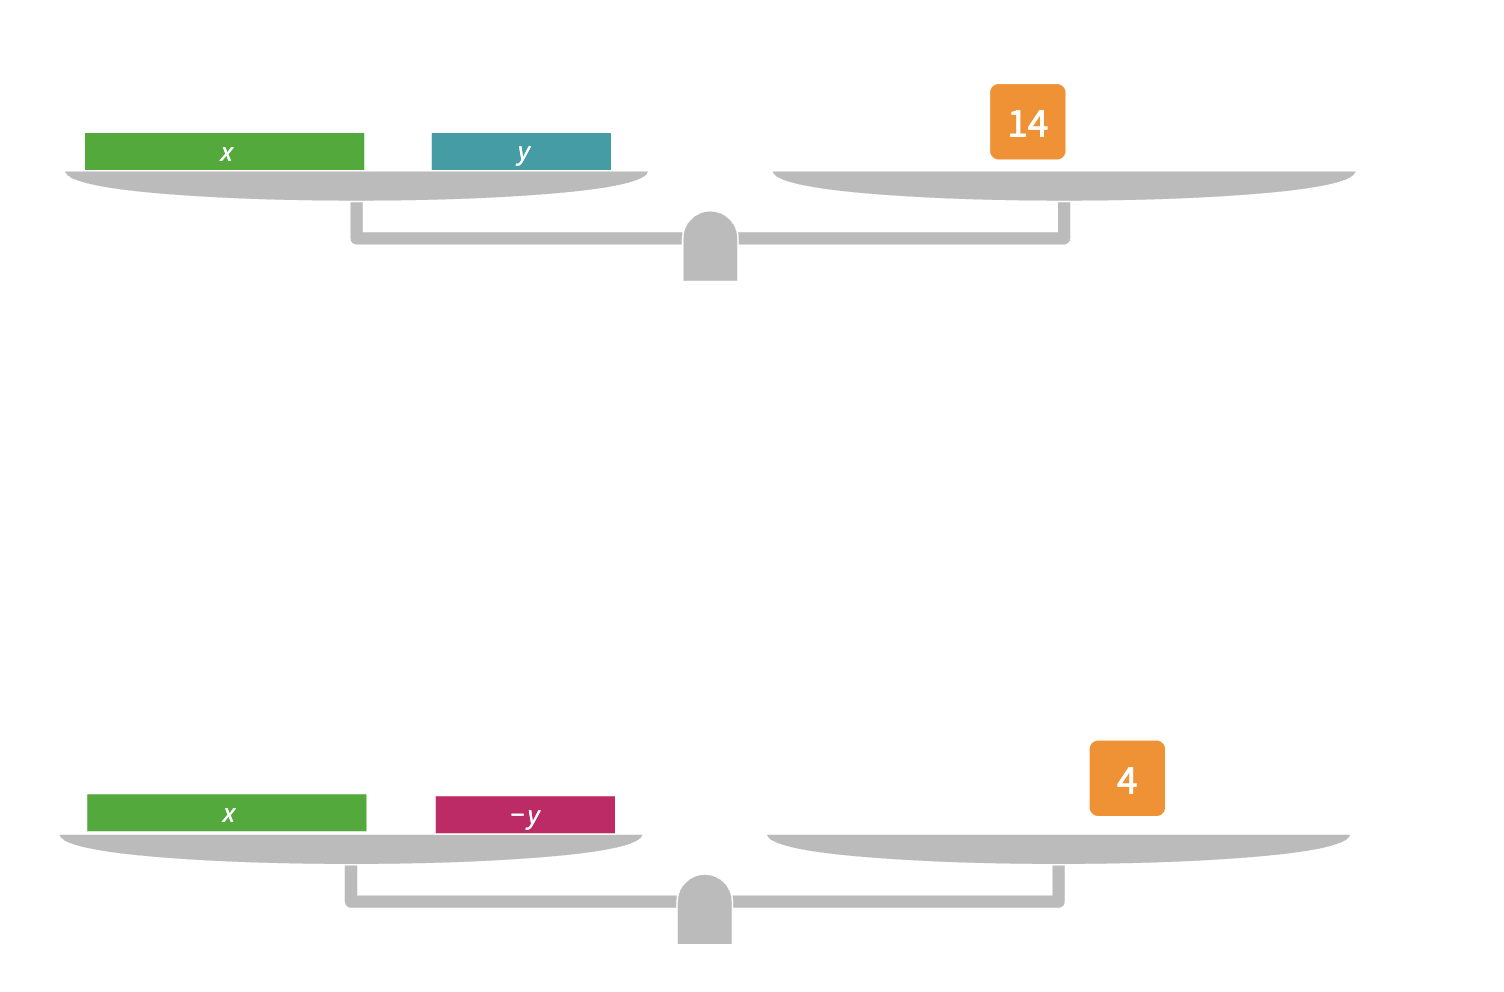
I then used Polypad to show them this linear system:
I asked them to tell me what the two equations were (i.e. x + y = 14 and x – y = 4) and then showed them how we could combine these two equations and, with the power of the zero pair, end up with a simplified equation to solve.

When students saw the y and the -y bars actually be eliminated in front of their eyes, it really did seem to help them make sense of the algebra. What I like about Polypad is that I can show something visually and then alongside it write what is happening symbolically.
The students were then given other linear systems to solve in groups at the whiteboards and we were happy with what they did. Having the students work on the vertical whiteboards allowed us to move from group to group giving feedback when necessary.

This dealt with elimination when one pair of the variables are opposite quantities (e.g. 3y and -3y). But what happens when they are the same quantities (e.g. 4x and 4x)? Well, Polypad can help us again:
Finally, what happens if the linear systems do not have variables in equal or opposite amounts (e.g. 3x + 2y = 16 and x + y = 4)? Well, Polypad allows us to visualise manipulating one of these equations to create a 'match':

When the students reviewed solving linear systems by elimination, it was pleasing to see how well they did:


My thanks go to Ms. K. Perri and her wonderful class of students.
Here are the links to the various Polypads that I have created to help teach this:
Linear Systems 2


Tuesday, May 9, 2023

Developing Some Circle Properties


Circle properties are new to the Grade 9 de-streamed math course here in Ontario. Personally, I have always enjoyed these: not just the proving of them but also solving questions where you have to deduce which properties to use.

Recently I visited a class to help students develop these properties. My approach is to do so using the concrete-diagrammatic-symbolic continuum and to encourage students to make conjectures before we formally prove a particular property. 

I start by giving every student a paper circle and a sheet with four sections for each of the properties we are going to explore. My first instruction is to fold the circle in half and I demonstrate with my own larger circle. It is worth your while making sire every student does this accurately: some will need your help. Then I simply ask: what have you just made. Most are comfortable in replying that the fold we have made is in fact the diameter. Then I tell them to fold it in half again; in doing so, most can tell me that we have now found the centre of the circle so we can now mark this on and draw the radius. I also ask them to draw the corresponding radius on the opposite side. 
The next step is to fold the circle so that the radius on one side of the circle lines up with the radius on the other side. In doing so we create a chord (which we draw on and label) that is perpendicular to the radius. 
It is worth your while to check that your students make this fold accurately and that the chord is 90˚ to the radius. Now I ask the students to think about anything that they notice and wonder. This, in essence, is a conjecture and they write this down on their sheet:
In this particular case, most of the students noticed that the radius appears to perpendicular bisect the chord and ask them to check this conjecture with a ruler. After they confirm that seems to be the case, I then ask if it will always be the case and show them this Geogebra demo:
Of course, this still doesn't prove that it works for all cases so now I prove to them why it is always true. I love showing proofs like this to students as, once they see it, it is very visual and intuitive. I also think it is so important that they get to see what a proof is and to know why something is always true (as opposed to just trusting me that it is). The key thing here is that when we add the radii to the diagram we create two right-angled triangles and from there we use the Pythagorean rule:
Once we have proved this property, we write a formal definition in the section on their sheet marked 'Theorem'.
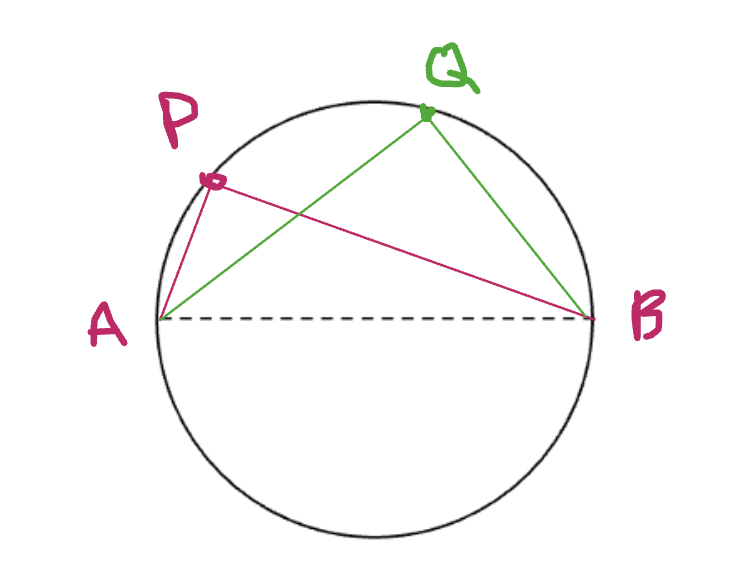
The next property we look at is angles in a semi-circle. On their sheets I ask them to mark a point P on the circumference of the circle and to join this to the end points (A and B) of the diameter. They repeat this for a second point, Q, and again I ask them to make a conjecture:
In one class I did this, one student made a conjecture that the 'higher up the point, the larger the area of the triangle'. I had never heard this before so we spent a couple of enjoyable minutes thinking about the truth of this statement (I will leave it to the reader to prove this!).
Most students conjectured that the angles were right angles and we checked this with either protractors or the corner of a sheet of paper before I showed this Geogebra demo:

Again, this is not a proof per-se, so I then walk them through a visual proof as seen below. The key thing I emphasise here is that when you draw on radii in a circle, you can create isosceles triangles galore!
Again, after we prove this property we write this as a formal theorem on our sheet.

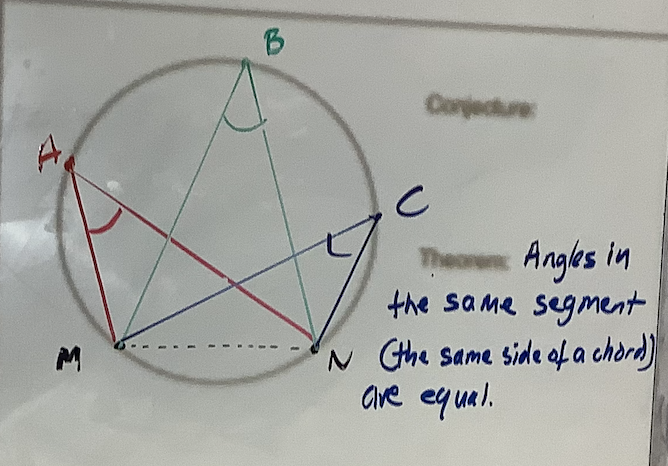
The next property we look at is angles in the same sector (or angles subtended from a chord). We start by marking two points, M and N, on the circumference and joining these to make a chord. Now we join points P, Q and R to the endpoints of this chord (as shown) to create three angles:
Most students made the conjecture that these angles were equal, so I gave them tracing paper to confirm that this was the case (they simply drew the angle P and placed it on angles Q and R to see that they were equal). A quick Geogebra demo also illustrates this idea:
The proof of this property follows more naturally from the last one we look at so we then write the formal theorem:
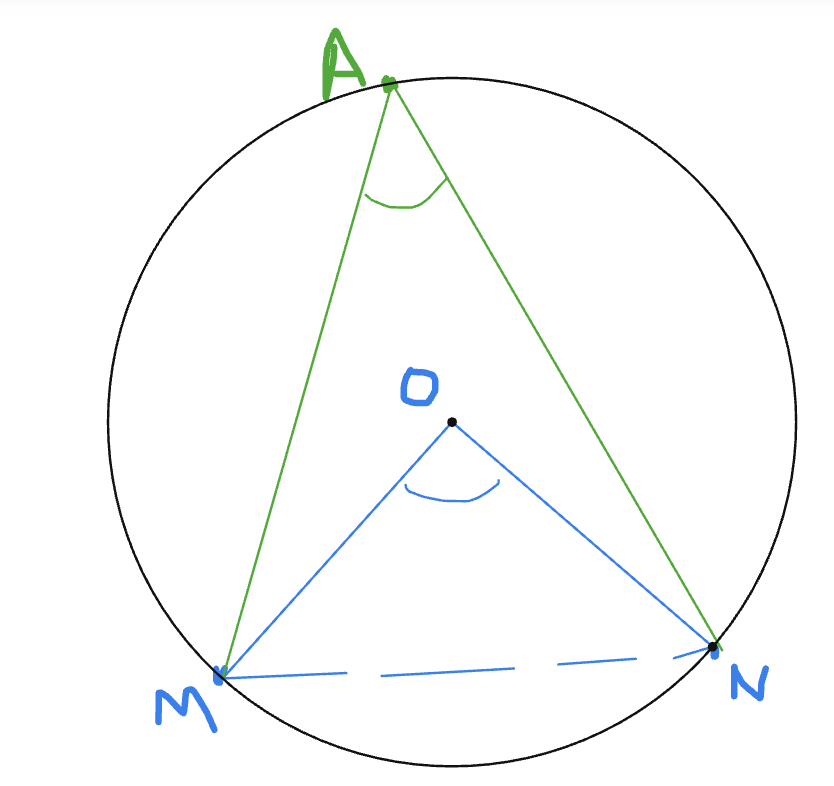
The final property we look at (angles at the circumference are half the angle at the centre of a circle) is what I used to think of as the Star Trek property! Again, we start by drawing a chord MN and joining the centre, O, to the endpoints M and N. We do this also for a point A on the circumference: for the sake of visual clarity, I suggest a point towards the top of the circle.
Not as many students were as confident about making a conjecture for this property but when some suggested that the angle at the centre was double the angle at the circumference, I asked them to check this with their tracing paper: they traced the angle at the centre, folded it in half and then checked that this was the same as angle A. Again, we illustrated this with Geogebra:
Again, we can prove this visually by making use of isosceles triangles:


Now we know this, the third property can be proved simply:
I like to finish the lesson by giving this real-life challenge: how can you find the middle of a circle if you cannot fold it. For example, hopw would you find the centre of this wooden circle if you needed to drill a whole in the centre?
Most groups simply want to estimate where the diameter might be and draw two of these to get an approximate centre, but this group used the second property to draw a diameter more accurately by putting a right angle on the circumference:
I then take this idea and show how we can draw two (or more) diameters by using property 2 and thus finding the centre of the circle:

The slides and links that I used for this lesson are part of a presentation that I recently gave at the OAME Annual Conference in Toronto and can be found here.


Wednesday, March 20, 2019

Scaling Up

One of the biggest hurdles to mathematical understanding is moving out of additive thinking into multiplicative thinking. There are many reasons why students get stuck in an additive phase so what can we as teachers do to move them into a multiplicative phase?
I worked with a Grade 9 Applied teacher recently who noticed from her diagnostic tasks that many of her students could not think multiplicatively. As they were about to begin some work on ratios this was going to be a problem. We decided to adopt a concrete-diagrammatic-symbolic approach to move students on from additive thinking. 
We began with a simple problem:

The weights of two dogs as puppies and fully grown are shown:

Which dog grew more?

Without exception, the students said that they grew by the same amount (i.e. 6 kg). They were looking at how much weight had been ADDED.
So we then asked them, is there another way of thinking about this. After a bit, one student noticed that the first dog had DOUBLED in weight whilst the second dog had not increased by the same rate.

This was the platform we needed to build on.

I was clear with them: we need to learn how to compare things not just by addition but also by multiplication. I told the that we were going to do some activities that would help them how to see things in terms of multiplication and not just addition, and that this would make them better mathematicians. 
I also told them that we were going to do this in three steps: concretely, then diagrammatically, then symbolically. 

Each student was then given a set of cuisenaire rods.
I told them to find two orange ones and put them end-to-end. "If one of these is 10, how much will two be?" "20!" came the instant reply.
I then told them to put a yellow rod directly below the two orange ones (and showed this using the mathies.ca Relational Rods tool). I then asked them to estimate how many rods would be need to match the two orange rods. 

After they made some suggestions, I asked them to find out and then tell me how much a yellow rod was worth: they were able to tell me that it was 5.
I then asked them to write a number sentence for what they had just done. Over half wrote 5+5+5+5=20 so I then asked them to write a number sentence without using an addition sign. This nudged them toward multiplication and they wrote 5x4=20.

Again, I was clear with them: this is the goal of today's lesson...to think multiplicatively.
Next, I asked the students to do this again but this time with the purple rod. Seeing the students carefully lining up the rods to make sure they were equal to the two orange rods (and the four yellow rods) made me realise that maybe this is the experience that they had missed out on: the actual concrete act of creating equality using equal groups.
They wrote 4x5=20 without any prompting. One student then noticed something: "I can write it another way without using addition. If you split the rods up again you are dividing the 20 so you can write them using divisions!"

This led to related facts:
4×5=20
5×4=20
20÷5=4
20÷4=5

Next, I told them that as they were grasping this so well, it was time to scale up: now we need to use larger numbers and that these would be better modelled with diagrams. So I asked them to write a set of related facts for this diagram:
From this alone, they were able to write:
20×6=120
6×20=120
120÷6=20
120÷20=6
No-one wrote 20+100=120. We were seeing the students shift away from additive thinking.
Curious I wrote down my favourite math fact on the board:
37×3=111
and told them that we were about to scale up again. I asked them to complete the set of related facts which they were able to do even though they had not learned the 37-times table!

We then split them into visibly random groups and gave them a problem to try:
Two people do some decorating. Ann worked for 2 hours, Bill worked for one hour. Together they were paid $30. How much should each person get?
As the groups worked on this, it was clear that they realised that it would be unfair for the people to be paid the same amount. Most groups got the sense that Ann should get paid twice as much as Bill and used different ways to come up with an answer. We summarised their their thinking by using a bar model approach:
This allowed them to see the 'three-ness' of this problem and allowed them to see that each hour block is equivalent to $30÷3 or $10. We then challenged them with the following set of problems and encouraged them to use bar models to show their thinking.
It was pleasing to see many of them successfully use the bar models to solve the problems (though I wish I took more pictures of their work).

When I asked how they felt about this concrete-diagrammatic-symbolic approach at the end of the lesson, the students told me that it really helped them. 

Sometimes it takes just a well-timed nudge to move students on.

Wednesday, May 23, 2018

Thinking Outside the 'Box'

I'm a big fan of the array or 'box' method for multiplication (as I blogged earlier here.)  A twitter chat with Britnny Schjolin last week raised this troubling point however:
I know that many of my colleagues are also impressed by it even though they, like me, might not have see it when they were students. I have also worked with colleagues who have openly stated that the 'box' method is not the proper way to show your work or that they don't like it so they won't show this to their students. I'm not sure how widespread such attitudes are but I honestly feel that we are doing our students a huge disservice by not showing them such a powerful representation that allows for so many different connections to be made. If this means that we as teachers should learn something new, then so be it: as educators we must always be prepared to learn new things.

To show how useful I have found this, here is how I recently solved a problem that I came across by using arrays or the 'box' method. 


Prove that the product of four consecutive numbers is always one less than a perfect square.

I started pretty conventionally by trying to generalise the product of four consecutive numbers:


Well, I don't fancy working out that product, but I know if I rewrite the four consecutive numbers like so:
Now I can rearrange to make use of the difference of squares to make something a little more delightful:
 A quick array is drawn to help me work out this product:
Since I have to prove that the product is one less than a perfect square then I need to consider this:
I am good at factoring quadratics by inspection but not so good with quartics! However, I now decide to draw a square array to help me factor by working out the components of each side. The first part solves itself:
To get the 2a³ term, I need to split this symmetrically across the square and think what the next component must be. This makes things very clear:
 This also helps me get the middle product:
 Now to get the -a² term, I need to have a -a² in each of the top right and bottom left cells:
This immediately gives me the last component from which I can write the term as a perfect square:

Thus the product of four consecutive numbers is always one less than a perfect square.

Now, before I learned about the array or 'box' method, I would have chugged through with the algebra and probably would have eventually reached the same conclusion. However, now I can attack and solve such problems in a fraction of the time and with more clarity. This is why we must teach this method:


It is an incredible mathematical tool.

It is not a new idea either. Recently, for fun, I have decided to work my way through Silvanus P. Thompson's classic Calculus Made Easy and I came across this:

Array models were being used back in 1910!

Monday, February 12, 2018

Creating Thinking Classrooms (1)

I have been reflecting a lot on Peter Liljedahl's work in the past few months and have been more intentional about implementing his ideas in any of the classrooms I go into. In particular, I am trying to gauge the impact of using three of his optimal practices:

  • start with good questions;
  • use vertical non-permanent surfaces (VNPSs);
  • and use visible random groups.

This week, I went into a grade 8 class who had been working on measurement. I began the lesson by showing them a game called 'Prism or No Prism!' which involves me holding up a shape and the class deciding if it is a prism or not. For the most part, they were correct but about half the class said that a cube was not a prism. When I asked why, they said because it is a cube! As they weren't too clear about what a prism is, I shared with them my 'loaf of bread' analogy:
If a shape can be sliced like a loaf of bread from front to back and give exactly the same size and shape slice, then it is a prism.
"So that would make a cube a square-based prism then!" said one student.
Next I wanted to ascertain that they knew how to get the volume of a prism. The 'loaf of bread' analogy works well here to as we can connect it to layers (or slices) that can be made thinner which leads us to develop the idea that the volume of a prism is the area of one 'slice' multiplied by the 'number of slices' into the more generalised formula, V=Axh
In all of these discussions, we did not look at cylinders.
I then showed them the opening act of Dan Meyer's Popcorn Picker:
I asked "What do you notice? What do you wonder?" Some wondered if one cylinder would give more popcorn than the other cylinder. Others reckoned that the cylinders would give equal amounts of popcorn. So the task was set:
Decide which way you want to make your cylinder. It will then be filled with popcorn!
I used playing cards to create visibly random groups of three students each and then gave each group one marker each and had them work at VNPSs.
The students got stuck into the task immediately, even though they have never been shown the formula for the volume of a cylinder. Whilst there was the occasional dead end (one group got stuck on using V=lxwxh before realising that this wouldn't work with a cylinder!), the students soon reasoned that since the cylinder is a prism, they could work out the area of the base circle and multiply this by the height for each cylinder. Getting the area of the circle requires knowing the radius and some did this by direct measurement whilst others measured (more easily I'd suggest) the circumference of the circle (that is, of course, one of the sides of the rectangle and then divided this by 2π to get the radius.


One of the great things about VNPSs is that as a teacher, it makes it easier for me to see what students are thinking and any errors that they might make.
When we were satisfied that the students had reached a conclusion, we noticed that seven groups opted for the shorter, wider cylinder and one group opted for the taller, narrower one. I filled one of each of these cylinders and, by then emptying the popcorn on the table, we could see that visually most groups had got it correct. It turned out that the group that didn't had the right idea but made a calculation error.
With the students merrily munching on popcorn, I was able to summarise the lesson by using their work on the VNPSs around the room and got them to tell me the formula of a cylinder:
The use of good questions, VNPSs, and visible random groups certainly proved effective in getting these grade 8s thinking. I wondered how it would be for younger students.