Thursday, June 13, 2013

Fraction Flags

When I was 10 years old I did a project on flags. It was one of my many happy school experiences and ever since then I've always loved flags. Whenever I go to a different part of the world I always try to get a local flag. I visited Vermont a couple of summers ago and managed to track down and buy this wonderful Green Mountain Boys flag. One of the things I like about flags is that they are positively brimming with maths. For example, with the Green Mountain Boys flag, what is the ratio of length to width? What fraction of the flag is green?
I get the sense that my vexillophilia is something that is shared with a lot of students. We took advantage of this recently in a Grade 3/4 split class. We wanted to see what students knew (or didn't know) about fractions. In particular, we wanted to see what they knew about equivalent fractions.
As a Minds On activity, we played this Flags Recognition Game (left) and we were quite impressed as to how well the kids did; between them they covered a lot of cultures and heritages and they were proud to share this.
We then followed this up with this Fraction Flags Game where we asked the kids how we could colour a flag according to some given fractions. For example, we asked them how we could colour a flag that is half gold, a quarter white and a quarter green. We could display these suggestions quickly on the interactive white board as shown below:
As the students explained their solutions we heard the beginnings of some ideas about equivalence: it was a perfect time to get them to design their own flags based on a 6 by 4 template similar to the flags above. This is the task we gave them:
Design a flag for this school or for your family. Explain what fraction of the flag each colour covers.
We gave them some guidelines as to what makes a good flag as shown below:

We did this so that they wouldn't design flags that made it very difficult to see what fraction each colour covers. The great thing about this activity is that it forced out some common fraction misconceptions that we could address using the students' work.
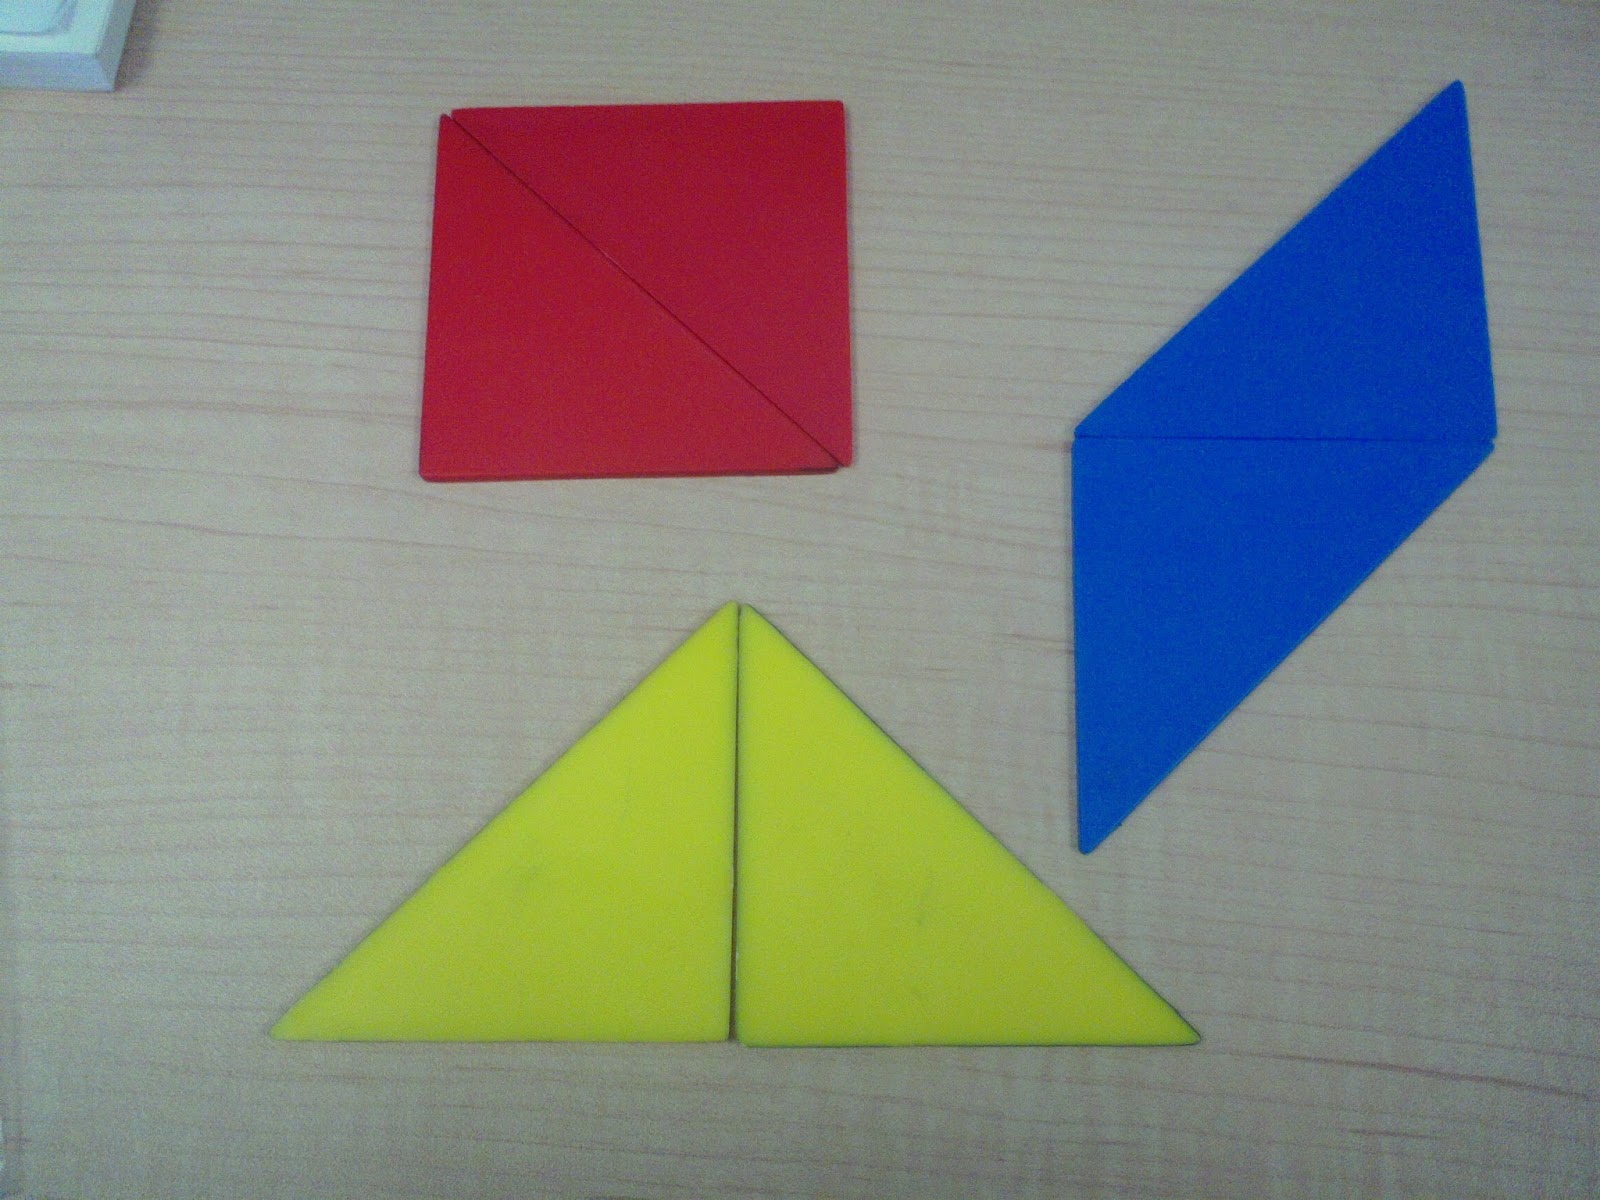
The first misconception is that equivalent fractions are congruent. In other words, some students think that if two fraction pieces look different, then they cannot be equivalent. Looking at these flags, though, allowed us to challenge this notion:

 In the example on the left, most students would agree that each colour covers a quarter but would be less sure about the example on the right. By comparing the area of each piece though we were able to challenge their misconception and get them to realise that equivalent fractions aren't necessarily congruent. After this student had completed his flag, we asked him to draw another with the colours covering the same fractions:

The second misconception is that fraction pieces have to be joined together. For example, some students would look at this flag...
...and not see that half of the flag is blue. They might say that two-quarters of the flag is blue but believe that it can only be a half if the two blue sections are together. This misconception prevents them from seeing equivalence.
This student (below) clearly explained how she could pick up one of the coloured pieces and 'match' it with a piece of the same colour and so each colour covers a quarter of the flag.

And this student is already comfortable with the idea of equivalence as seen in his answer:
 
This student clearly explained how both of his flags were half blue and half green. If a student is unsure about this we could show them both and ask "Which is more blue?" This forces them to think about bringing the blues together and hence seeing how 12/24 (or 3/6) is equivalent to a half.

So by the end, we certainly got students to realise that equivalent fractions don't necessarily look the same and that the fractions pieces don't have to be joined together. We would need to back up these ideas by considering fractions that are sets of abjects (and not just fractions as area as in these examples).
And just for the record, my favourite flag is the West Riding of Yorkshire Flag (below). What math questions can you see in it?

Tuesday, June 11, 2013

Using Tangrams

I have been growing more and more fond of tangrams recently. I used to think they were just for making pictures that might (or might not) look like a man on a sledge (right).
Now I use them for exploring geometric properties and also for some proportional reasoning problems. Recently I went into a Grade 3 class and, to get them used to the tangrams, we began by telling them story of how tangrams were invented (as told in Virginia Pilegard's book The Warlord's Puzzle.) Basically, a special tile that was made for a VIP fell and broke into seven pieces. Many people tried to fit the pieces back together to make a square but with no success. Then came along a little boy who solved the puzzle and achieved fame and fortune (Hollywood should really make a film about this).
I then asked the students to take the two large triangles and ask them what shapes they can make with these. Usually, it doesn't take too long before students come up with a square, a parallelogram and a triangle (as shown below).

But after a while we got these other shapes which begged the question: What are the names of these shapes?


It is so important that students can construct irregular polygons to help them truly appreciate geometric properties.

Our next puzzle was straightforward to present to them:
If the small triangle costs 10 cents, how much does the whole tangram cost?
Occasionally, we get some students say "70 cents" as they think each piece is 10 cents; we reply to this by asking why the smallest piece would cost the same as the largest piece. The reasoning and proving, reflecting, representing and communicating that came out of this problem was great to see as seen in the video below:
I have varied this problem for older students by asking them to find the price of each piece if the whole puzzle cost $4.00. Also you could ask the students what fraction of the whole tangram each piece is.
What I love about tangrams is that, given the right questions, students really do use them to help model their thinking. They also get students thinking about how shapes can be decomposed and recomposed. This is an essential skill that will come in useful later when they work with areas of irregular shapes.
And next time you make a toasted sandwich, how about you tangramise it?!

Thursday, May 30, 2013

Mind Your Language (2)

Ask a group of students (or adults come to that) to draw a parallelogram and see what the most common answer is. When I have done this (with students, educators and parents) by far and away the most common shape is the example A below. I will even have a drawing like this prepared and reveal it to the 'audience' and announce that I read their minds to such an extent that I knew that the longest side of the parallelogram would be horizontal and that it would slope left-to-right.
Rarely will folk draw a parallelogram like B and even more rare will they draw a rectangle or square. This might seem innocent enough but can be a big clue to a huge misconception that often goes unnoticed. This was evident in a Grade 6 class I saw this week. We had given them this question from the 2012 Ontario Junior EQAO test:
 
 
It's a nice question as there are a variety of ways to think about solving this. One student solution was shared with the class and provoked some great discussion:

Some students argued that the shape on the left wasn't a parallelogram. One student argued that it was as parallelograms are shapes that have "...two pairs of parallel sides." Years ago I would have left this statement unchallenged. Now, I jumped at the opportunity it gave and asked if the shape below was a parallelogram:
Probably half the students said yes it was; they understood that a parallelogram is any shape with two pairs of parallel sides. The remainder of the class seemed unsure. We then got in a debate as to whether or not a regular hexagon is a parallelogram(!); some said no as it had three pairs of parallel sides, others said yes as it had at least two pairs of parallel sides.
As we mused how to deal with this, a student asked if she could look up the definition of parallelogram. This she did, and there it was: "A parallelogram is a quadrilateral with two pairs of parallel sides." This was news to a lot of students. However with this new knowledge they were now OK with saying that the rectangle in the solution is also a parallelogram.
On reflection, I now realise that giving insufficient examples and using imprecise language  restricts students' understanding of what a parallelogram is. It would be better for students to construct their own understanding of what a parallelogram is by showing them something like this (from Ontario's MOE's Guide to Effective Instruction Grades 4 to 6: Geometry) and asking them to define 'parallelogram'.


Wednesday, May 29, 2013

Mind Your Language (1)

Look at this number and say it out loud: 6.125
How did you say it?
'Six point one two five'?
'Six point one hundred and twenty five'?
'Six decimal one two five'?
'Six decimal one twenty-five'?
A few years ago I would have paid no attention to the language that I used to say decimals. In England (where I first taught) I used to say 'six point one two five' so when I first came to Canada it amused me somewhat to hear 'six decimal one two five'.
However, research by Sue Willis (First Steps in Mathematics) made me realise that I wasn't saying decimals properly and that this was not helping students understand decimals.

It is no big secret that decimals are one of the big ideas that really seem to stump some students (and adults). I've taught a lot of tricks to help learners cope with decimals but these were just papering over the cracks: they didn't help students understand the quantity of decimals.
More importantly, I couldn't fathom out what students thought decimals meant. Using a diagnostic provided in First Steps made it a lot easier for me and my colleagues to see what students were thinking. For example, what are students who make this error thinking?:
These students are saying the numbers incorrectly. in example (iii) they are saying 'three point five hundred twenty one, three point six and three point seventy five'. And since 521>75>6 then 3.521 is the biggest number of the three. For example (v) they simply ignore the leading zeroes and say 'four point nine, four point seven, and four point eight'. Fascinating, eh?
Now look how these students often answer the following questions:
I must have had so many students make this mistake without ever realising what they were thinking; instead of correcting their misconception, I tried to give a rule.
Think about how these students get this and then watch this explanation:
 

This is not a one off. I reckon there will be students in every school who make this error.
So how do we correct this? Sometimes by simply saying the number correctly:
"Six and one hundred twenty five thousandths."
This is often enough to students to rethink. In example (v) above, when students say 'four and nine hundredths, four and seven tenths, four and eight thousandths' they often realise 'Hey, seven tenths is much bigger than nine hundredths'. I can convince them of this by modelling these quantities (of which more in a future post).
Skip counting with decimals is also  a really useful activity. Students who make the above error will often continue a pattern that starts 1.2, 1.4, 1.6,  like this: 1.8, 1.10, 1.12, ...
However by saying the pattern as 'one and two tenths, one and four tenths, one and six tenths, one and eight tenths, one and ten tenths...' at this point we often see students realise 'Hey, ten tenths are one whole so it must now be two'. To reinforce this, we can use a calculator: type in 1.2 + 0.2 then keep pressing =,=,= and students will see the count continue. It is a great moment of cognitive dissonance when they see the '2' instead of the expected '1.10'!
These two diagnostics take very little time to do but have helped me so much in correcting students' misconceptions.

Tuesday, May 21, 2013

A Measurement Mea Culpa

I apologise.
I apologise to any of my previous students who I messed up by saying that the perimeter is "... the distance around the outside of a shape." I meant well, I really did.
But I lied. The perimeter is most certainly not the distance around the outside  of a shape.
I realised this error by looking at students' responses to a seemingly straightforward length question:
This is the type of response we were expecting:

 
 Instead we faced something like this:
Notice that in the left hand path, the student has got 15 in two different ways (the 'outside' path and the 'inside' path) but that this is by luck: the student counted squares that are not involved in the length. Other students made similar mistakes:
There is a definite theme here: counting squares as opposed to line segments.
This response is very telling:
The student has got the right answers (15 and 17) but for the wrong reasons. And if they hadn't have shown how they got the answer (by writing the numbers in the squares) I would have been none the wiser for it. I probably would have thought that they 'got' it. Again, mea culpa.
So how did this misconception arise?
Probably as a result of the 'count the distance around the outside' rule that has been impressed upon the students. Or maybe students' initial concrete experiences with measuring length involved using, say, square tiles to measure a pencil and so they now think 'squares' are used to measure length. As a result of this, I would certainly get students to use popsicle sticks, string, etc to measure length (i.e. objects that are more blatantly 'length' rather than 'area'). I also now refer to the perimeter of a shape as the sum of all its sides.
So if you have a student who thinks that the perimeter of this shape is 18...

... then show them how highlighting the sides forces us to find the sum of the sides of the rectangle:

Friday, May 10, 2013

Reflecting on Transformations

A few years ago I read a book about the geometer, Donald Coxeter, called King of Infinite Space:The Man Who Saved Geometry. Written by Siobhan Roberts, it is a wonderful insight into the mind of Coxeter who was in love with geometry. What fascinated me about him was how Coxeter, the world's greatest geometer, learned about geometric properties and relationships:


It got me realising that if Coxeter uses manipulatives to learn about geometry, then so should I and so should my students.
When I first started teaching I told students to reflect, rotate and shift shapes by "imagining how they would look after the transformation".
Not brilliant advice any way you look at it.
However, when I started giving tracing paper (or acetate sheets) for students to draw the object and then to find the image, immediately there was greater success. I saw this again in a Grade 6 class this week. We gave the students this question from Ontario's Junior EQAO test of 2010:

Initially, students could sort of make out a reflection, a rotation and a shift (or translation... though I myself don't really like that term because of its ambiguity). However, they had trouble describing  these transformations.
That was until one student walked to the front of the class to help herself to a small sheet of acetate paper that we had surreptitiously placed. And this is how she used this tool to help her tackle the problem:
The tool that she chose suddenly made it so much easier for her to describe the transformations.
Accurately as well.
And when other students saw what she was doing, they immediately wanted to use the acetate too. As one lad said, "It makes my thinking clearer."
                                   *                                       *                                      *
If you want to see engaged students, give them some of M.C. Escher's prints and ask them to find and describe as many transformations as they can. Guaranteed fun.


Friday, April 26, 2013

Why We Need to Listen (1)

I (and pretty much most of my colleagues) have been raised in educational systems where your achievement was measured almost entirely through written products: quizzes, tests, exams. Sometimes these 'written' products were multiple choice tests and involved no writing at all to be evaluated. As teachers, this reliance on a written product is a hard habit to break; it is a habit which I have spent no small amount of time trying to justify to parents and students in the past. 
In the past few years, however, I have been completely deconstructing my original beliefs on how to evaluate students. If truth were to be told, I don't think I was ever truly comfortable with the way I was evaluating students. I often faced situations where I knew that students understood a particular concept but this wouldn't be reflected in what they wrote down. Or maybe I wasn't good enough to interpret what they were writing. Consider this question which I gave a Grade 8 class:
One morning, a cake shop bakes four hundred donuts. They sell two-fifths of these before lunch. They sell one-quarter of the remainder after lunch. How many donuts are left at the end of the day?
Now look at what this student wrote and ask yourself what grade you might give this (If you teach in Ontario, you might want to consider what level you would give this for Communication).
 
Now listen to what the student says when she explains her solution:

I have shown this to hundreds of educators across Ontario and the experience is always the same. Initially most people say that the student's thinking isn't clear. After listening to the explanation almost everyone agrees that the student does indeed explain her thinking clearly.
It stands to reason then that if we are not intentionally incorporating observations and conversations into our evaluations then our evaluation practices are ineffective.