Here in Ontario there has been a recent spate of articles in the media regarding the province's standardised test scores in Math (the EQAO results). Most of these have been written by people with no or very little background in mathematics education. Some, in particular this
one by a Margaret Wente from
The Globe and Mail have been so crass and incoherent that I felt I had to write a response, shown below. I got a reply from an editor who said that he liked and agreed with my arguments but requested that I edit it as it was too long and that I should avoid specifically rebutting the Wente piece (heaven forbid that we offer a counter argument). My edited reply did not get published as apparently the news cycle had moved on.
So here it is, because I cannot stand by and listen to uniformed nonsense any further.
The recent article by Margaret Wente contained so many unsubstantiated claims and vagaries that I feel compelled to write in response. I have a Math degree, an Honours Specialist in Math and I am currently studying for my Masters in Mathematics Teaching at the University of Waterloo (whose Math Department is world-renowned). I am also a Math Consultant for the Durham CDSB and as such I work with students and teachers from Kindergarten to Grade 12. I have a love of Math and a love of teaching and in my role I see what methods are successful and what methods are not.
The first issue I have is the emphasis on Math being nothing more than merely the memorizing of facts, formulae and standard algorithms. Any mathematician will tell you that this is not what Math is about. Math is the study of patterns: sometimes this is patterns in numbers; sometimes it is patterns in shapes or patterns in data. The famous British Mathematician G.H. Hardy wrote “A mathematician, like a painter or poet, is a maker of patterns. If his (or her) patterns are more permanent than theirs, it is because they are made with ideas.” Facts, formulae and standard algorithms are but a tiny part of Math and if taught improperly do nothing to improve students’ number sense. In fact there is plenty of research (e.g. Kamii (2000), Fosnot and Dolk (2001), Cockburn and Littler (2008) to name but a few) that standard algorithms (if taught before the students are ready for them) can actually undo their number sense. I tell my students and teachers that good mathematicians look at the numbers first before they decide what to do. For example, look at these questions:
1) $4.99×5
2) 800-481
3) 37+38
4) 2368+9417
If the only way that you can answer these is to use a standard algorithm then you do not have good number sense. I want my students to look at the first question and think ‘$25 take away 5 cents’ as opposed to reaching for pencil and paper to write out the multiplication. I have seen Grade 4 students efficiently do the second questionin their head without any need to use the algorithm. Instead they use good number sense (‘800 take 400 gives 400, then take the 80 to get 320 then take the 1 to get 319’). I give the third question to parents at Math Nights that I run and very few use the algorithm to get the answer. Some do 40+40-5, others do 37+40 to get 77 then take 2, others double 38 to get 76 then take 1. These parents are not ‘baffled and confused’ by the methods they use but they do agree that it makes no sense to say to a child that they have to use the standard algorithm to get the answer. I actually did the fourth question (one that was in the article) in my head working from left to right far more quickly than anyone could do by writing out the standard algorithm even though Ms. Wente states that the algorithm is efficient. This is a common myth about algorithms, that they are quicker and more efficient. There may be times when this is the case but these times are surprisingly rare. Really, would anyone suggest that the best way to do 1000-995 is to use the standard algorithm? Or to work out how much change you would get from $10 if your Tim Horton’s bill is $7.85?
Ms. Wente states that the curriculum has ‘downgraded arithmetic to near-invisibility’ and that children will ‘not understand fractions, will not learn to multiply or divide two-digit numbers on their own’. It is a pity that she did not take the time to do a bit of research and actually look at the curriculum. If she had looked in the Ontario curriculum for example she will have noticed that fractions begin being taught in Grade 2 and are a huge part of the Number Sense and Numeration strand in each grade thereafter, including learning standard algorithms for adding, subtracting, multiplying and dividing fractions. If Ms. Wente had used any basic journalistic skills, she would have noticed that in the Ontario curriculum students will learn to multiply and divide two-digit numbers in Grade 4. It is worth pointing out here that the standard algorithms for multiplying and dividing are not the only ways of doing so. There are other pencil and paper methods which we show students and parents which work just as well and are just as efficient (just Google ‘array multiplication’ and ‘Elizabethan multiplication’ to see these in action). When I have shown these methods to parents at Math Nights they often comment how much more clear these are compared to the standard algorithms.
There is also a myth in that if a student can do the standard algorithms then they are good mathematicians. This is not the case. Computational understanding is not the same as operational understanding. I know students whose parents have spent a lot of money on certain well-known Math clinics so that they can do long division but, when these students are given a word problem, they do not know what to do: they are not sure if they should add, subtract, multiply or divide the numbers; or which numbers they should work with; or the order in which they should work with these numbers. When students are taught the algorithms by rote this operational sense is something that is not developed; it is the Achilles heel of certain well-advertised after school Math programs. When I hear people emphasise the importance of getting students to do these standard algorithms by rote I must point out the research by Northcote and McIntosh (1995) which shows that most adults do not use written algorithms in their daily lives.
Ms. Wente also states that ‘For years, Math professors at our leading universities have been telling elementary and high-educators that their methods don’t work’. Well, I went to a four-day Math Teachers conference at the University of Waterloo in August and this certainly wasn’t the message. On the contrary, there was an emphasis on getting students prepared by making sure that they are good problem solvers, flexible thinkers and not reliant and facts and formulae that they don’t understand. Not once did any of the professors say ‘Make sure that they know their long division’. The ‘discovery’ method which was alluded to by Ms. Wente is in fact the method that Mathematicians use all the time. The great geometer Donald Coxeter said“The best path to learning is hands-on… leading to the thrilling intellectual buzz of a self-made discovery”. Karl Freidrich Gauss (arguably the greatest mathematician ever) said“It is not the knowledge but the act of learning, not possession but the act of getting there, which grants the greatest enjoyment.” When it comes to getting advice about how to best teach Math, I will defer to Coxeter and Gauss and not to Ms. Wente.
Should students learn their basic number facts and multiplication tables? Absolutely. But a better question is ‘How should they learn their facts?’. Rote memorization is not good enough. It leads to what is referred to as pattern interference whereby rules, formulae and facts get confused and the learner is unable to apply these in problem solving situations. Understanding why rules work is crucial. For example, knowing your nine times table is all very well but will not help you efficiently figure out 9×37. Knowing that nine times a number is the same as ten times a number minus that number is far more powerful and will let you figure out that 9×37 is just 370-37 or 333.
Should teachers have a greater comfort level with teaching Math? Absolutely but a better question is ‘How should teachers get a greater comfort level?’ Simply teaching from a textbook, giving out worksheets is not the answer. The faculties of education must revisit how much time they allocate in their programs to Math (often a poor distant cousin to Language). If one looks at countries that perform well in international Math tests prepare their teachers there is a common theme: Collaborative Inquiry. Teachers participate regularly in lesson study, watching students tackle problems and then engage in professional dialogue to learn from what they have seen. It is a process which Ontario’s Ministry of Education has been using and the teachers whom I work with have said is the best professional development they have had.
Should we improve the standard of Math education in this country? Absolutely. Why would you want to lower it? But responding to the cries of ‘back to basics’ (whatever that means) from people who have no background in Math Education is not wise. Instead, look to the countries we want to compete with and see how they approach Math. For example, in Singapore, Finland and Japan the curriculum is not dominated by rote learning; it is dominated by problem-based learning balanced with opportunities for students to practice what they have learned. I would respectfully suggest that the next time the Globe and Mail wants to make a meaningful contribution to improving Math education they don’t give platforms to people with no background in the area and that instead they do some proper journalism and seek the educators who have consistently gotten their students to love Math and be successful at it, no matter what grade they teach. These are the people who will be much better placed to inform your readers of what good Math looks like and what good Math learning and teaching looks like.


 When I was 10 years old I did a project on flags. It was one of my many happy school experiences and ever since then I've always loved flags. Whenever I go to a different part of the world I always try to get a local flag. I visited Vermont a couple of summers ago and managed to track down and buy this wonderful Green Mountain Boys flag. One of the things I like about flags is that they are positively brimming with maths. For example, with the Green Mountain Boys flag, what is the ratio of length to width? What fraction of the flag is green?
 As a Minds On activity, we played this Flags Recognition Game (left) and we were quite impressed as to how well the kids did; between them they covered a lot of cultures and heritages and they were proud to share this.


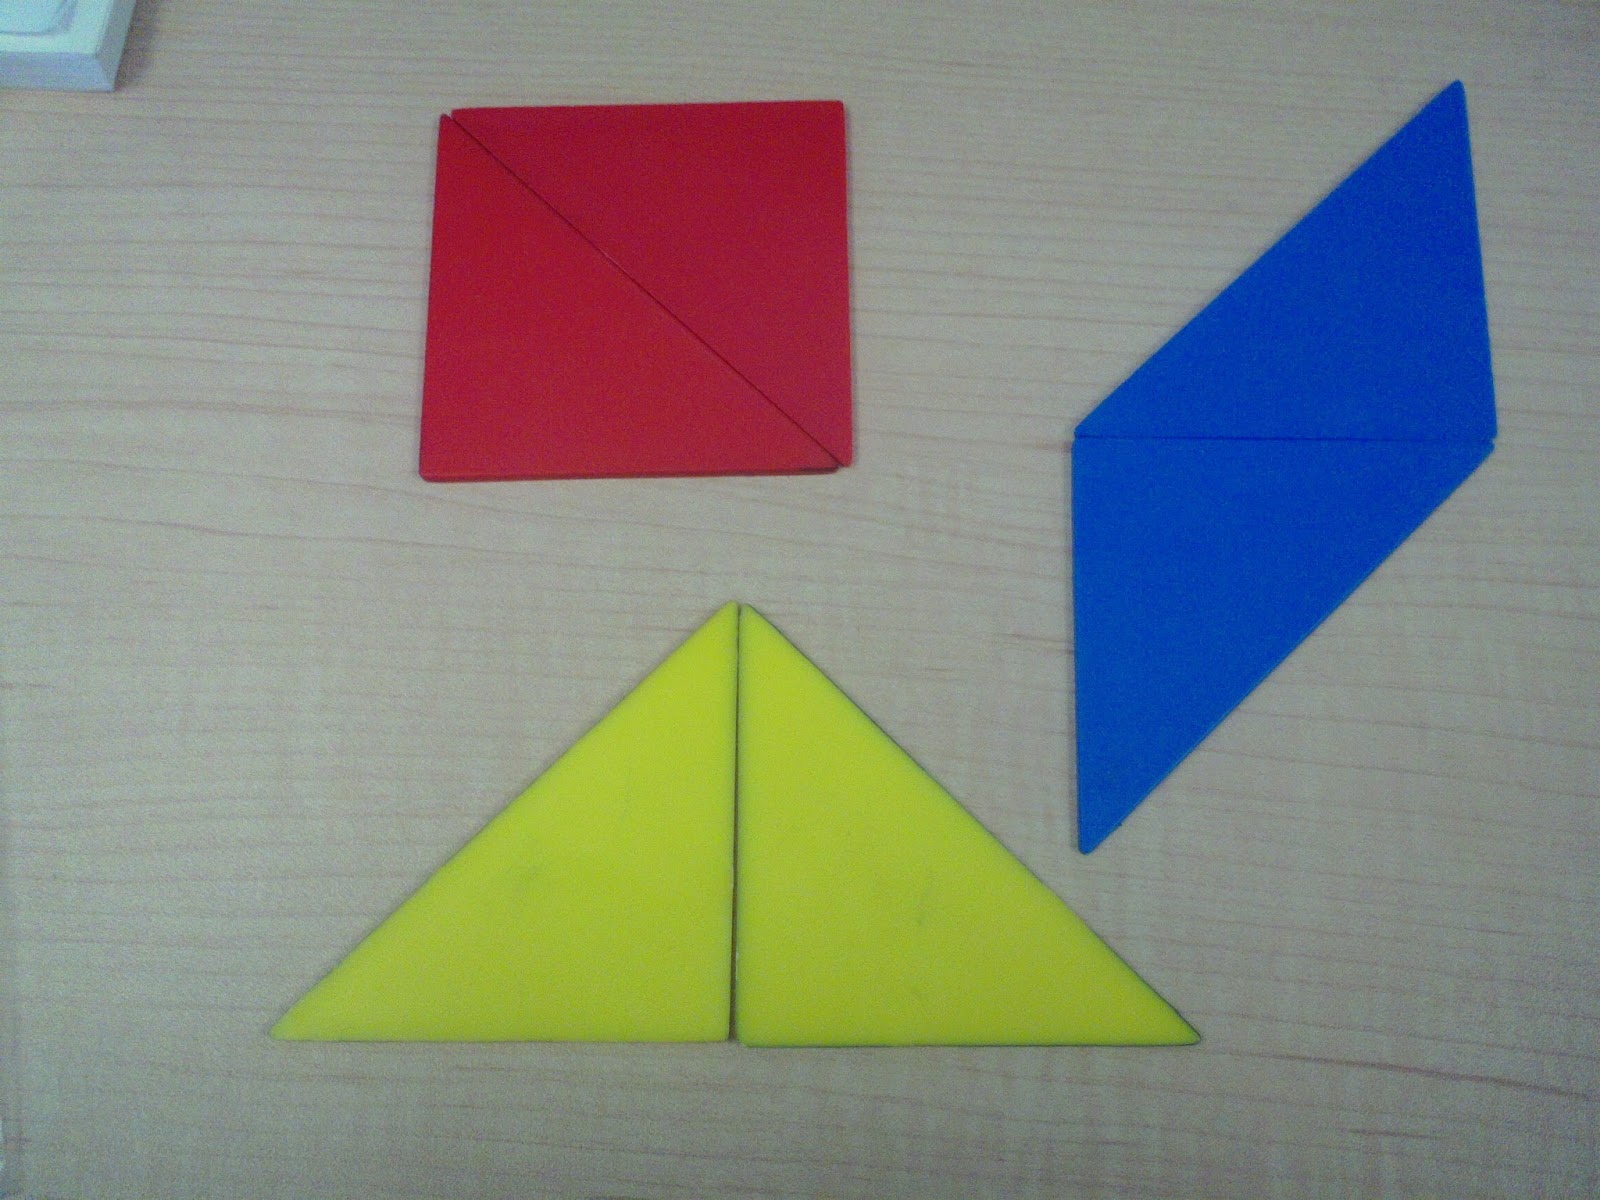
 I have been growing more and more fond of tangrams recently. I used to think they were just for making pictures that might (or might not) look like a man on a sledge (right).
 Now I use them for exploring geometric properties and also for some proportional reasoning problems. Recently I went into a Grade 3 class and, to get them used to the tangrams, we began by telling them story of how tangrams were invented (as told in Virginia Pilegard's book The Warlord's Puzzle.) Basically, a special tile that was made for a VIP fell and broke into seven pieces. Many people tried to fit the pieces back together to make a square but with no success. Then came along a little boy who solved the puzzle and achieved fame and fortune (Hollywood should really make a film about this).