Wednesday, March 19, 2014

What Does the '=' Sign Mean?

Here is a video of two students in a Grade 9 Academic class talking through their solution to
              -15+x= -x+15.
As you listen to it, can you figure out the misconception?
Despite the otherwise articulate description ("... you need to isolate the variable..." etc.) there is a real fundamental (yet common) algebraic misconception here which is:
when you bring a term to the other side, it switches sign.
I've been wondering when such misconceptions begin. More to the point, I'm wondering if students truly appreciate the meaning of the '=' sign. If we reduce algebra to a bunch of tricks that needs to be memorised ("... when the number jumps over the gate it trips and so it changes sign...") then these might cause these misconceptions.
Some research that Christine Suurtamm presented at the OMCA conference in February also shines light on a common misconception. Students were asked to solve the following problem:
8+4=?+5
This is a breakdown of how different grade responded:


Notice how in each group the most common response is 12. Is this because students translate the '=' sign as 'Now do what you have just read' (in this case 8+4)? If the students have only experienced questions of the type 8+4=? and not, say 8+?=12, then it is no surprise that they make this mistake.
Notice also how that none of  the Grade 5s and 6s (in this study) got the actual answer correct. Is this because their Math experience is now more about following rules and less about understanding the concept? Have these students really developed the concept that the '=' means that the expressions either side of the sign are balanced? It is crucial that they do this. In the book Mathematical Misconceptions by Anne Cockburn and Graham Littler, the point is made that equality is a central but a neglected concept and that there is a strong correlation between the ability to understand the '=' sign and the ability to solve equations.

Even seeing how numbers can be decomposed and recomposed will help with this. For example, asking students to think of how many different ways 12 animals can be split between 2 fields would generate a lot of answers of the type that we can write as 12=8+4 (as opposed to 8+4=12).
Or if I put 5 green marbles and 9 black marbles in one side of a set of scales and 3 red in the other side, students will see that the pans are not balanced. I can ask how many blue marbles do I need to add to make the scales balanced? There are a variety of ways to solve this and when I consolidate the students' thoughts I can tell them that they have really solved this equation
5+9=3+?
Or written another way:
                                        14=3+x
With younger grades, they will rely on their number sense to solve this not some contrived (and partially understood) rule. Activities like this will help students really understand the meaning of '='.
                                          *                               *                                 *
There are some great thoughts and ideas on equality in the Ministry of Ontario's Paying Attention to Algebraic Reasoning document, especially on pages 6 and 7.

Monday, March 3, 2014

Spatial Reasoning

I was at a Ministry-run conference last week working with other Math-folk from all over Ontario and suddenly had an epiphany regarding Spatial Reasoning. To try and understand what Spatial Reasoning is, have a look at this video and predict which of the five squares below the paper will look like when it is unfolded:


I haven't come across a precise definition of what Spatial Reasoning is but in general, most folk agree that it involves visualising, perspective taking, mental transformations, composing and decomposing (shapes, numbers, measurements, data, and algebraic expressions). Nora S. Newcombe in this excellent article says 'Spatial thinking concerns the locations of objects, their shapes, their relations to each other, and the paths they take as they move.' She goes on to show how Spatial Reasoning is not a 'learning style'  but a habit of thinking, that for anyone it can be improved, that whilst there may be gender differences, the important fact is not the causation of these differences but that both genders can still improve their Spatial Reasoning.

My big lightbulb moment was when I realised that Spatial Reasoning is so much more than geometry. Indeed it transcends Math. It is a way of thinking that helps us solve problems in number, measurement, algebra, geometry and data handling; in science (figuring how the atoms in a molecule are arranged); in technology (any work on perspective or visualising how to build a certain structure); in sports (reading the shape of an opponent's defence or making a 'no-look' pass); in the arts (seeing the sculpture in a block of marble or the visualising of dance moves that a choreographer must make; in geography (any map making or map reading activities); in history (visualising what a building must look like from the clues found in an archaeological dig).
This got me wondering, though, how aware are we as teachers of Spatial Reasoning and much time do we spend on it? Working with some colleagues at my table we quickly came up with the following ideas just in Maths:

Primary:
  • Use positional language as much as possible
  • I'm thinking of a shape that looks like a triangle and a rectangle stuck together. Draw what it might be.
  • There is a shape in this bag. Feel it but don't look at it. Now tell me what you think it is.
  • Imagine holding a can of soup. How many circles might you see?
  • I have a letter. When I turn it upside down, it still looks the same, What might it be? What couldn't it be?
  • You measured the table width with your pencil and it was 10 wide. My pencil is twice as big as yours. In your head, imagine me measuring the width. Would I use more, less or the same as your pencil?
Junior:
  • I have two rectangles and put them together. What shape could I end up with?
  • I cut of the corner of a square. Use a geoboard to show the shape I cut off and the shape that I'm left with.
  • I have joined 6 cubes together. From the front, they look like an I. From the side, they look like a T. What do they look like from above?
  • Visualising the mean as an evening out of all the scores as shown in this post.
  • Visualise two congruent triangles. How could you arrange them to make a parallelogram? How does this help us get a formula for the area of a triangle?
Intermediate:
  • Imagine two congruent trapezoids. How could you arrange them to make a parallelogram? How does this help us get a formula for the area of a trapezoid?
  • Imagine unfolding a cylinder. What shapes will you see? How would you work out the area of these shapes.
  • Imagine two lines. One crosses at (-4, 0) and (0,4). The other crosses at (0,-2)  and (2,0). How would these lines look?
  • Imagine completing the square like this
Senior:
  • I have a function that has four roots and a range y<4. What could my function be?
  • Imagine you slice a cone. What are the different shapes that the cross-section could be?
  • Imagine you have three different planes. How many different ways could they intersect?
  • How many zeroes are at the end of 125!
  • What happens to the secant through two points in a curve as the first point gets closer to the second?

In fact, I will go so far to say that visualising techniques (far more so than rote memory of rules and formulae) are essential in understanding calculus.

After the session, I engaged in a wonderful Twitter dialogue with Malke Rosenfeld who is also learning about the importance of Spatial Reasoning. I highly recommend her blog here.

And as for the solution to the paper folding exercise? Check below!


Monday, February 24, 2014

"Whatever you do to the top,..."

I wonder how many people read the title of this post and automatically completed it by saying "... you must do to the bottom." It's a phrase I was drilled in when learning about equivalent fractions, a phrase I used myself when I started teaching. It was only after seeing student work like this one that I began to wonder on the wisdom of using such tips:

So when I think of some of the standard procedures for adding, subtracting, multiplying and dividing fractions, I wonder if as teachers we are guilty of rushing in too quickly to computational strategies before students have a solid enough understanding of the quantity of fractions. I read a quote by Jon Allen Paulos that made me ponder on this even more:
"Mathematics is no more computation than typing is literature."
Recently I was at the Ontario Mathematics Coordinators Association's annual conference. The keynote speaker was Christine Suurtamm from the University of Ottawa. Among the many great ideas and activities that she led us through was this one: 
You can see my solutions to the first two questions. What I love about the questions is that I can see how they will expose and challenge many misconceptions that students have about the quantity of fractions. This gives us an opportunity to fix these misconceptions which in turn will put students in a better position to understand any computational procedures they will need to learn.
Of course, we took up the challenge to describe another structure and then have a colleague build it. My challenge was to build a hexagon that is 3/5 yellow, 1/5 green and 1/5 blue; a simple enough question to state but it provoked a lot of thinking. Chad's challenge to me was to build a hexagon that is 1/6 green, 1/2 red and 1/3 blue. After I came up with one answer, I wondered if others were possible and indeed there was. Are there others?

What I really liked about this activity was its openness: there are so many points of entry and it truly is a 'low floor, high ceiling' question.
This was followed by a 'Fractions War' game. If you are unfamiliar with 'War' games, two players have a pack of cards and both turn over one card. The player with the higher card wins. As Sean and I ran through this game, we faced this situation: 


It reminded me of a misconception that I've often seen where students compare the numerators (and see 3>2) then the denominators (and see 12>4) and then conclude that 3/12 must definitely be bigger than 2/4. These students have not had enough hands-on experience to understand the quantity of fractions like those shown above or in a previous post on Fraction Flags .
And if students really do think that 3/12>2/4, how would teaching them to add these two fractions be beneficial for them?


Wednesday, February 5, 2014

Geoboards in the Car

So I'm driving my daughter to her dance class when she picks up my iPad and asks about the Geoboard app that is on there. I tell her that you can use it to make shapes like the ones she has been learning in class. "Make some trapezoids for example," I tell her. After a while she says "Done! Is this right?". "I can't look now I'm driving!" So we wait until a stop light and then (as she is sitting in the back) she shows me in the rear-view mirror:
"Great. Are they parallelograms too?"
"No... they only have one pair of parallel sides"
"OK. Now make some trapezoids that have a right angle". Now this took longer and a fair amount of "How is that possible?" until a little squeal told me that she got it:

"Right, now make some rhombuses". "Do you mean diamonds?". "No I mean rhombuses!" A little while later she showed me this:
"Hey, what other name can you give that small one in the middle?" A little pause and slight turning of the iPad and then "Oh, a square!!"
"Are all squares rhombuses?"
"Yes! Yes!"
"Are all rhombuses squares?"
"Yes! Wait...NO!!"
"OK. Now it's time to make some pentagons. But make sure that they have at least one right angle"
This is what she made:
I do know some kids who get confused as they think a pentagon will have five 'points' and therefore think that the elastics can only touch five pegs. Thus they won't see these as pentagons as they touch more than five pegs. This is a great opportunity to fine tune what we mean by 'points' and connect it to the number of sides.
Now I know you might be thinking 'Lucky girl, getting to do maths in the car whilst other kids are playing Angry Birds' but it was a neat way to spend 15 minutes. It got me wondering whether or not I prefer this virtual geoboard to the real thing and I think I might be leaning to the virtual side. For a start, the 'elastics' never snap and you never run out of them. Secondly, the vertices look more like they should. For example, look carefully at the 'corners' of this shape below and ask yourself if this really is a rectangle?
That being said, real geoboards are cheaper and I'm sure that some kids will prefer the tactile nature of these as opposed to the virtual geoboard. Either way, geoboards are a great way to get kids really to explore some geometric properties by asking questions such as:
Make a quadrilateral with 3 acute angles.
Make a parallelogram with two right angles.
Are all parallelograms rectangles?
 
For an extra challenge, I sometimes ask to make a shape which I know to be impossible (but the kids don't). This creates huge cognitive dissonance and often gets them reasoning why such a shape is impossible. For example:
Make a triangle with two right angles.
Make a quadrilateral with four acute angles.

Monday, January 20, 2014

Making Predictions

Here in Ontario, we have had some very cold and snowy weather recently. I took advantage of this in a Grade 5 class to see if the students could make predictions using line graphs. Getting students to predict what graphs look like is, in my opinion, as important as getting students to draw graphs from given data: it gets students reasoning, proving and reflecting.
Before going further, a little geography might be in order:
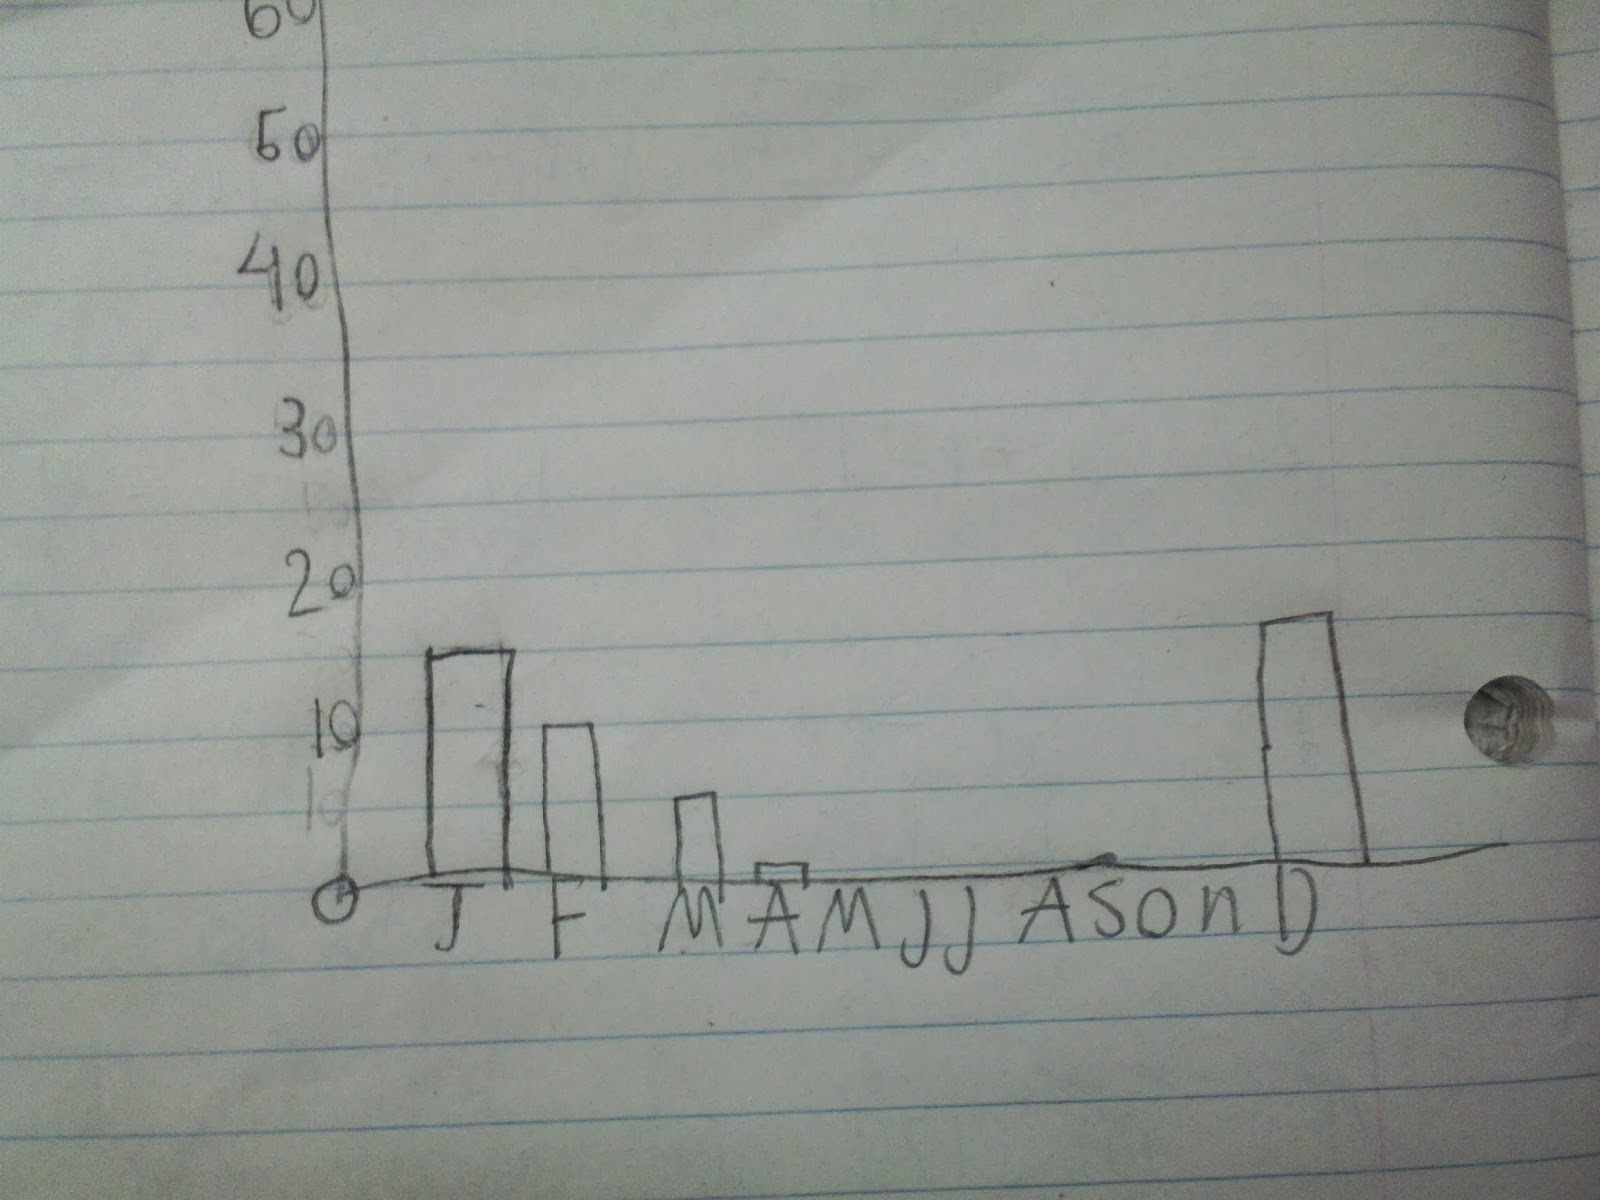
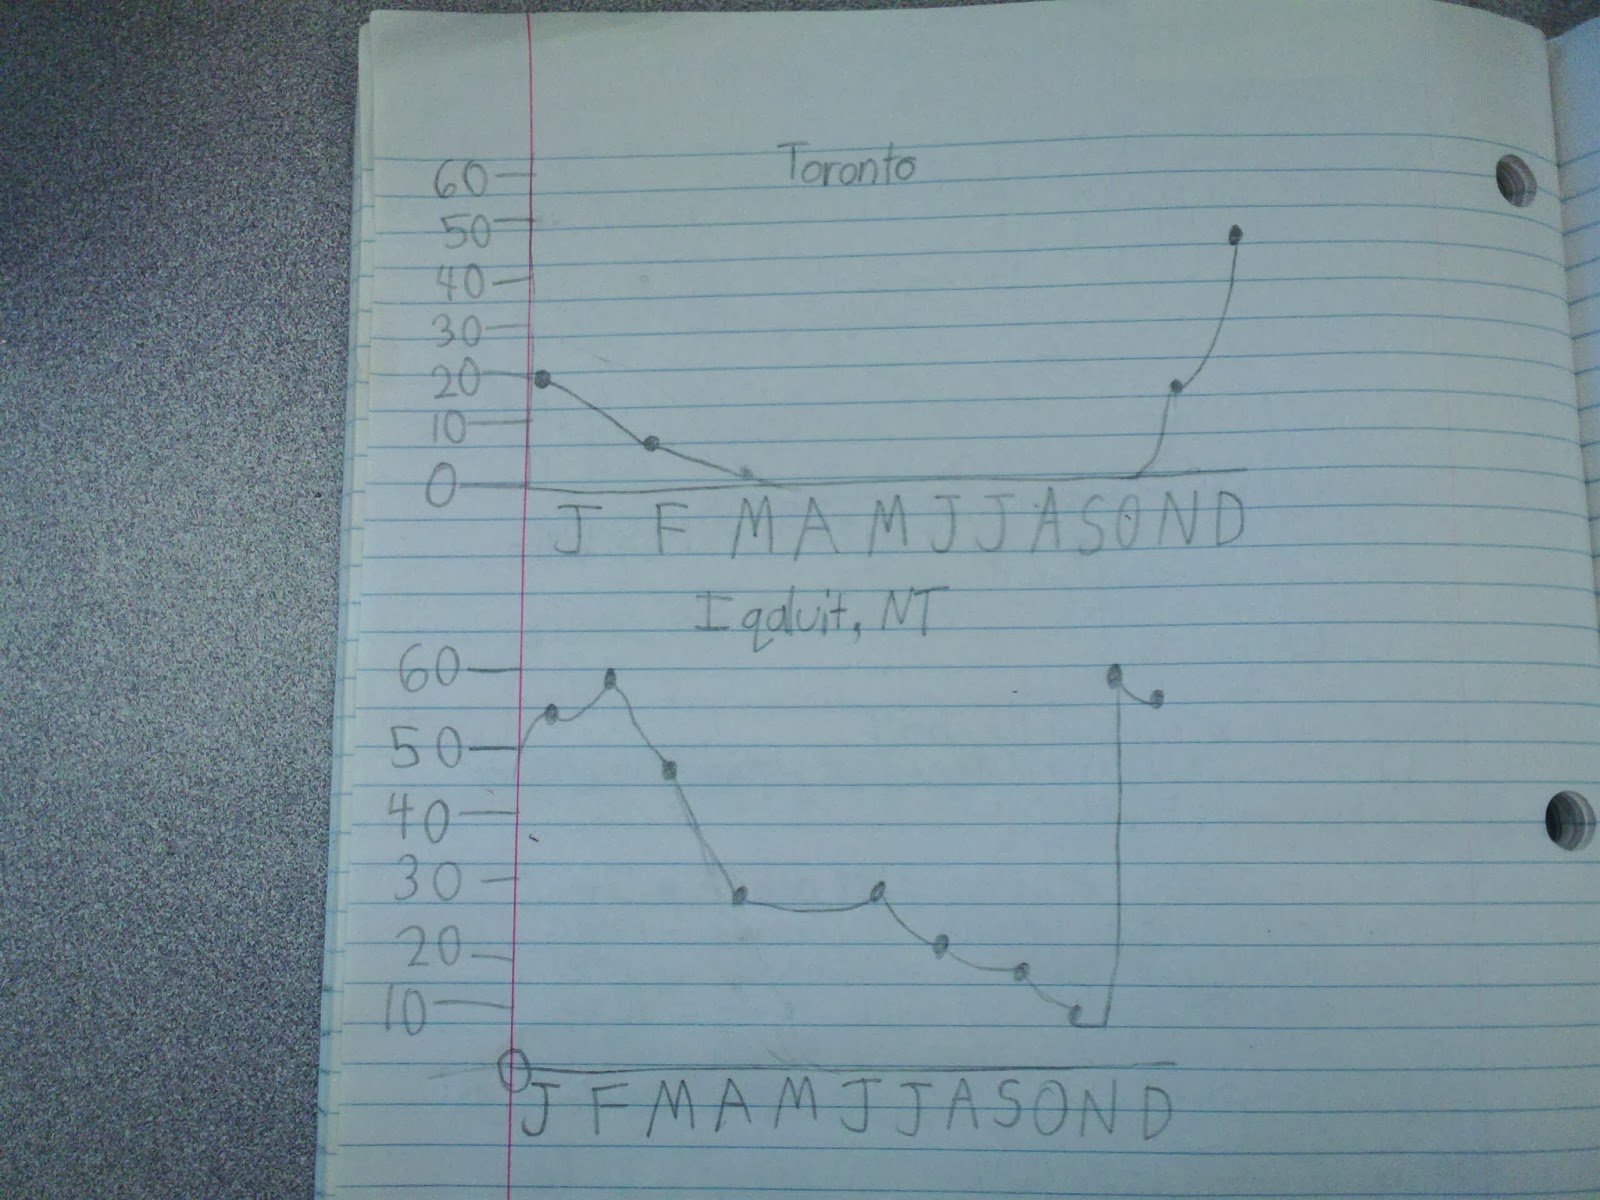
We asked students to draw a graph to predict what they thought the average snowfall per month in Toronto would be. A set of axes was drawn on the board to anchor everyone to the same scale. Initially some drew bar graphs, some vertical line graphs and some broken line graphs. As our goal was interpreting line graphs, we asked students to redraw (if necessary) their graphs so that it was a line graph. This is the sort of thing we saw:


We could then ask the students one of my favourite questions:
Look at your graphs: What is the same? What is different? 

We then showed them the actual graph from  a really neat site called CityStats.ca:

There were some great conversations about how close their graphs were to the actual graph, even though they did not have access to the primary data. Also there was great discussion about the red line, what it meant and how it looks as if Toronto gets less snow than the Canadian average.
So we then asked them to predict what the graph for Iqaluit would look like (Iqaluit, the capital of Nunavut, is in the far north of Canada). What we saw was a graph similar to Toronto's but shifted upwards:


We then showed them the CityStats graph for Iqaluit...

... and it was neat to see everyone reflect that their answer was wrong (and they were OK with that) but to then think of reasons why that might be. Superimposing the two graphs we noticed a curious thing:

Iqaluit gets less snow than Toronto in the winter months!
This was a big surprise to all the students (and most of the adults). Various reasons were suggested as to why this might be until one girl said "Well in Science we've been learning about the water cycle and because it is so cold in Iqaluit, all the water will be frozen and so there will be not as much moisture in the air so there will be less snow". Now I'm not sure if this is the exact scientific reason, but it was a very impressive hypothesis!
And a lot better than my 'It's too cold to snow' excuse.

Thursday, January 9, 2014

Elapsed Time Problems Using an Empty Number Line

Some time ago I gave students the question:
A movie starts at 3:40 p.m. and lasts 2 and 3/4 hours. What time will it finish?
The students (who had a very algorithmic approach to addition and subtraction) produced solutions such as: 
This particular student figuring that 5:85 is not a familiar time, decided that maybe he should have subtracted instead but then ends up with an equally bewildering 0:95!

In a previous post, I showed how the empty number line is a great tool to improve students' abilities in addition and subtraction. Today it was great to see some Grade 5 students use the empty number line to solve an elapsed time problem. The question we gave was as follows:
Mr. Huxter has a problem; he has forgotten his Grade 5 math and started cooking his turkey too late. His family couldn't eat until 8:30 p.m.! The turkey took 3 and 3/4 hours to cook. If his family wanted to eat at 6:00 p.m., what time should he have started to cook the turkey?
These students were able to decompose numbers in a variety of ways so were able to get the solution in a variety of ways:
 
One student used a mental number line to solve this and wrote his strategy thus:


We followed up the question by asking "What time did Mr. Huxter put his original turkey in?" It was again interesting to see a variety of successful approaches:  

This example below, the student starts by taking 30 minutes off to get to a friendly 8:00:
This question involved finding the start time using the end time and the elapsed time. It will be interesting to see how they solve problems when they are given the start and end times and have to find the elapsed time, or when they are given the start and elapsed time and have to find the end time. I suspect that as long as they continue to use the empty number line, they will no find these problems any more difficult.
In fact, past experience tells me that the more they use the number line, the more they will be able to visualise this and thus solve these mentally.

Wednesday, December 18, 2013

What Do Angles Measure?

I've had a lot of fun asking this question both to educators and students recently. Typical replies are; "They measure degrees"; "They measure the size of the vertex/point."; "They measure the distance between the two lines."
The last reply in particular leads to the common misconception that the angle A below is larger than the angle B.
To clarify what angles measure I do a little pirouette and tell people this:
Angles measure turn.
And as with all measures, we shouldn't jump in to teaching about standard units of measuring (degrees) until the students have had experience with non-standard units (e.g. full turns, half turns, right angles etc.)
I used to show students what a right angle is by pointing to the corner of a piece of paper. Now I get them to make their own right angle by doing the simplest Origami as shown below:
A question which I'm often asked is why is a right angle 90 degrees (and not, say, 100 degrees)? Well the answer lies in how many degrees are in a full turn and there will always be some students who know this, especially if they are into skateboarding or snowboarding: 360 degrees. So why 360 degrees? Well the ancient Babylonians were the first folk to consider breaking the full turn into smaller standard parts. They knew that the Earth took 365 days to go around the Sun (long, long before Copernicus) but they also knew that 365 was not exactly a friendly number to work with. they chose 360 instead as they used a base 60 for their numbers. Good job they did otherwise we would be saying that a right angle is 91¼ degrees!
So to get students to really understand the notion that angles measure turn, I have them estimate angles using some cheap-and-cheerful angle measurers as shown:

Here I want students to actually turn the arms of the angle to create the angle. Here is a video of a student using them in a class to see if the angles in a quadrilateral are greater than or less than a right angle.

I find if they have experience estimating angles first, then when they come to measure angles with a protractor, they will not be confused by the two scales that most protractors have.
Finally, to counter the misconception that angles cannot be larger than 360 degrees I might ask students to either use the cardboard angle measurer above or to stand up and turn 180 degrees, then again, then again and ask "How many degrees have you turned now?" This idea of having angles beyond 360 degrees will be important in higher grades when they start learning about periodic functions and unit circles as this site shows.