Tuesday, November 26, 2024

Quadratic Card Sort

My grade 10s have been working on quadratic relations and I thought that a good way to help them consolidate all their learning was to give them this card sort. I first saw this years ago in the NCETM's Improving Learning in Mathematics and I made some slight adaptations.


I started by giving the students these two sets of cards:


and they began cutting them out and matching the standard form to the factored form:

Immediately, there were lots of great discussions on factoring, too many almost to track!

When I saw that a group had made the correct matches, I then gave them these cards about the intercepts:

I had debated about whether I should label these with 'x-intercepts' and 'y-intercept' but then thought it would be better for the students to figure out this themselves (which they did!)

When these matches were made, I then gave them the seven graphs (created with the help of Desmos)

Lots of good connections were being made now as students used the factored form and the intercepts to make their decisions. They were then ready for the next set of cards which were the maxima or minima.

These were matched quickly: the graphs helped a lot but I was able to get students to check that each vertex lay halfway between the x-intercepts.
Finally, I gave the cards with the vertex form:

I have not done vertex form with them yet so I was curious as to how they would manage with these. But by using a bit of intuition, they matched the y=(x–5)^2–9 equation with the card that said 'Minimum: (5, -9)' I could then ask groups to expand and simplify the vertex form to see that it matched the standard form of y=x^2+10x+16.
As they beagan to match some of the other vertex form graphs, I could hear some groups making conjectures along the lines of 'Look at the co-ordinates of the vertex, make the x one opposite of what it is but keep the y one the same and then look for that equation.' In doing so, most groups came up with a full set as shown: 

At this point, I was able to get the class to see that when we write an equation in vertex form, it allows us to immediately see the co-ordinates of the vertex which, for some problem solving situations, is important to know. They will learn more about this in the next unit.

Finally, each set of cards purposely had a blank template so I challenged the students to create their own set of cards. I wish I left more time for this though as most groups did not have enough time to complete a full set of cards (a sample is shown below):

If you would like to try this yourself, the cards can be found here.

Monday, May 27, 2024

Kaktovik Numerals

 In August 2021, I stumbled across the wonderful Katovik numeral system.

Kaktovik is a city in northern Alaska. In the 1990s, the students at a school in Kaktovik realised that there were problems matching Hindu-Arabic numerals to the patterns of their Iñupiaq language. As part of their math enrichment class, they set out to create new numerals that matched their language.

The Iñupiaq language of Alaska uses a Base-20 for its numerals with subdivisions for groups of 5. There are some rule breakers (looking at you, 6) and numbers before a multiple of 5 have a subtractive element '-utaiḷaq' included so 14 is a bit like saying 15 – 1.


The students devised a brilliant numeral system that matched their language (revealed below). I created and shared a task that teachers could use to get their students to learn about these wonderful numerals. This was originally meant to be a task for Grade 9s but today I tried it with two Grade 8 classes for the first time.

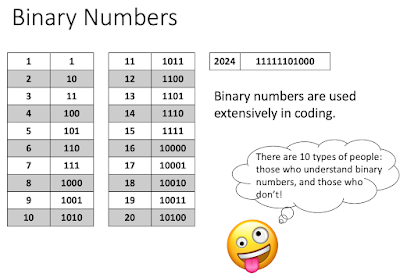
First, I showed them that they are already familiar withe different number systems that we use:

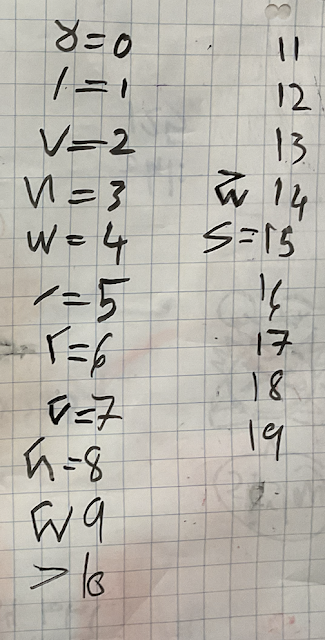
I told the students the story of how the students in Kaktovik wanted to create numerals that matched their language (as shown above) and then (after splitting the students into visibly random groups) I gave them the following clues and challenged them to find all twenty Kaktovik numerals:
Immediately, all groups got stuck into the task. The first two clues were quickly deciphered to give the symbols for 1 and 2. These allow us to make sense of the third clue to find the symbol for 3 which can then be used in the fourth clue to find the symbol for 5. The next clue (which represents 4 + 4) helps us to get the symbol for 8:
At this point, I did remind some groups that there was a pattern behind the symbols that matched the Iñupiaq language. Once they understood that the symbols were not random, they began to make sense of the pattern to complete the numerals to ten. The sixth and seventh clues helped them fill in some other values for 14 and 15:
The penultimate clue was quickly deciphered by most groups to get the symbol for 0 which then allowed them to make sense of the last clue: 10 times by 2 equals 20. Using Kaktovik numerals, this is written as one group of twenty and zero ones. There was a lot of excitement in the room as students completed their work:
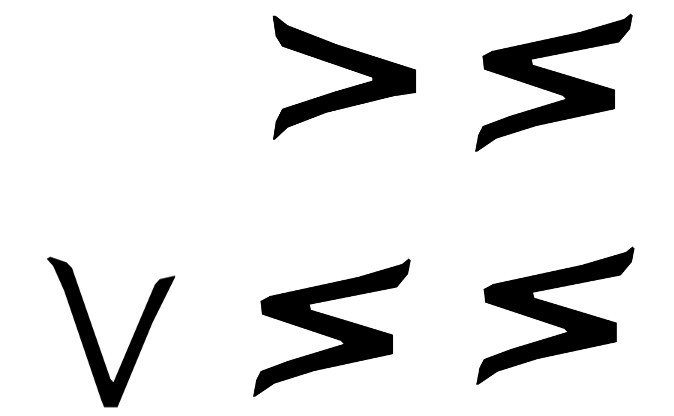
I then showed them how the place value columns in Base 20 differ to those in Base 10 i.e. to the left of the ones column, we have the twenties column and to the left of that we have the 20 squared (or four hundreds) column. I then challenged them to rewrite this Kaktovik numerals: 
This was definitely a challenge for some groups but I was pleased to see a lot of success with this.
Finally, I put up some 'Mild, Medium and Spicy' questions for them to try: 
This worked really well as students self-differentiated and all felt that they rose to the challenge:
There is now a Kaktovik numerals calculator app and I was able to show this to the students to check any given calculation. They really enjoyed seeing this!

I finished the lesson by making three important points:

  • There are pros and cons to any numeral system.
  • Don't assume that what you are familiar with is always the best way of doing things.
  • Anyone can create math that can have a positive impact on their community.

*            *            *

More information about the development of Kaktovik numerals and how they can be used to facilitate arithmetic operations can be found in this Scientific American article from April 2023.

UPDATE:

Some colleagues tried this in another Grade 8 class and saw this on one group's work!


Friday, December 15, 2023

Developing Some Triangle Properties in Grade 9

Triangle properties are now a part of the grade 9 de-streamed math curriculum and after doing some circle properties in a couple of classes, I tried a couple of activities intended to help students develop two important triangle properties. As usual, I wanted to use a concrete-diagrammatic-symbolic approach to this.

 I began by showing students this daigram and asking students what type of triangle it was:

Without exception, all students said it was an isosceles triangle...

I then gave each pair of students five segments of pre-cut stirrers and asked the students to measure them:
The lengths of these segments were 3 cm, 4 cm, 4 cm, 5 cm and 8 cm. I then asked the students to choose any 3 segments and see if they made a triangle with the condition that the segments must all join at a vertex. 
After about 5 minutes, I asked students to give me examples recorded the results as shown below:
I told the students that I would be able to say if there examples were correct by using a special property that I knew of. So when one group of students said that the 8 cm , 4 cm, 4 cm segments made a triangle I replied 'Not according to my special property'! When I looked at what they had done, I was able to point out that the segments were carefully joined at each vertex.
I then challenged students to figure out what was the special property that I was using. It didn't take long for them to articulate that the two shorter sides need add to give a number bigger than the longest side. My sense is that this realisation was helped by using the concrete segments. 
I then showed them the triangle again and asked what type of triangle it was:
Now they saw that it was an impossible triangle! I told them a story about this. A few years ago, I met with a group of developers from a well-known educational software firm who wanted us to see their product. At one point, they showed us some of the questions that their software automatically generated, including the diagram above with the question 'What is the perimeter of this triangle?' Tongue firmly in cheek, I said 'I will give $20 to anyone who can accurately construct that triangle.' I do remember getting a few bemused looks from the developers before I had to remind them of the triangle inequality. The students enjoyed this anecdote!

For the next property that I wanted to them to learn about, I led them by drawing these two triangles and asking them to identify the largest angle, smallest angle and the 'middle' angle.

Whilst most were able to identify the hypotenuse and explain that they knew it was the longest side, they were not all aware that it was opposite the right angle. It made me realise that how I use the word 'opposite' in this context isn't always intuitive for students, so it was necessary to draw on the appropriate arrows as I said 'opposite':
When I had shown which sides were opposite which angles, I then challenged them to find the second property. It gave me the opportunity to move around the room and listen to the conjectures (of which there were many) and, if necessary, challenge these conjectures. it wasn't long before we were able to summarise our findings: in any triangle, the longest side is opposite the largest angle and the smallest side is opposite the smallest angle.
In retrospect, I would should have pushed this thinking further by drawing not just right-angled triangles but acute and obtuse ones too. I also would include isosceles and equilateral triangles.
Although some might think that both of these properties as quite trivial, I see it as being very important that we make sure our students understand why these work. Firstly, by approaching these properties with activities such as these, we are also meeting expectations from Strand A: Mathematical Thinking. Secondly, if students know these properties, they can be used as a good check for glaring mistakes when they are finding missing lengths and angles in triangles.
We ended with this challenge:
It was interesting to see that the only triangle that was not identified correctly was the top right one: the right triangle with sides 4cm , 7cm and 8cm. Their reasoning was that it satisfied the triangle inequality so I then had to remind them that if it is a right angled triangle, then it also has to satisfy the Pythagorean Rule.
Many thanks to Mrs. T. Maecker and her two wonderful classes.

Wednesday, November 22, 2023

A Visual Approach to Solving Linear Systems by Elimination

I've been lucky enough to work with a teacher of a Grade 10 Applied class and we have been trying to adopt a more visual approach to help students make sense of solving linear systems. We began by challenging students with this puzzle:

The students worked in groups of three on vertical whiteboards and they did a pretty good job of solving this by mainly using a guess-and-check approach. It was interesting that most focussed on the middle two equations first. It allowed me to tell them that we would now learn some cool techniques to solve this pair of equations (i.e. b – c = 5 and b + c = 19). As there were some magnetic algebra tiles handy I then created some zero pairs and asked them what the value of each was:
Now it might seem like an obvious question, but in particular I needed to be sure that they were good with the idea that when they see 3x and -3x (six things), they combine to give 0.
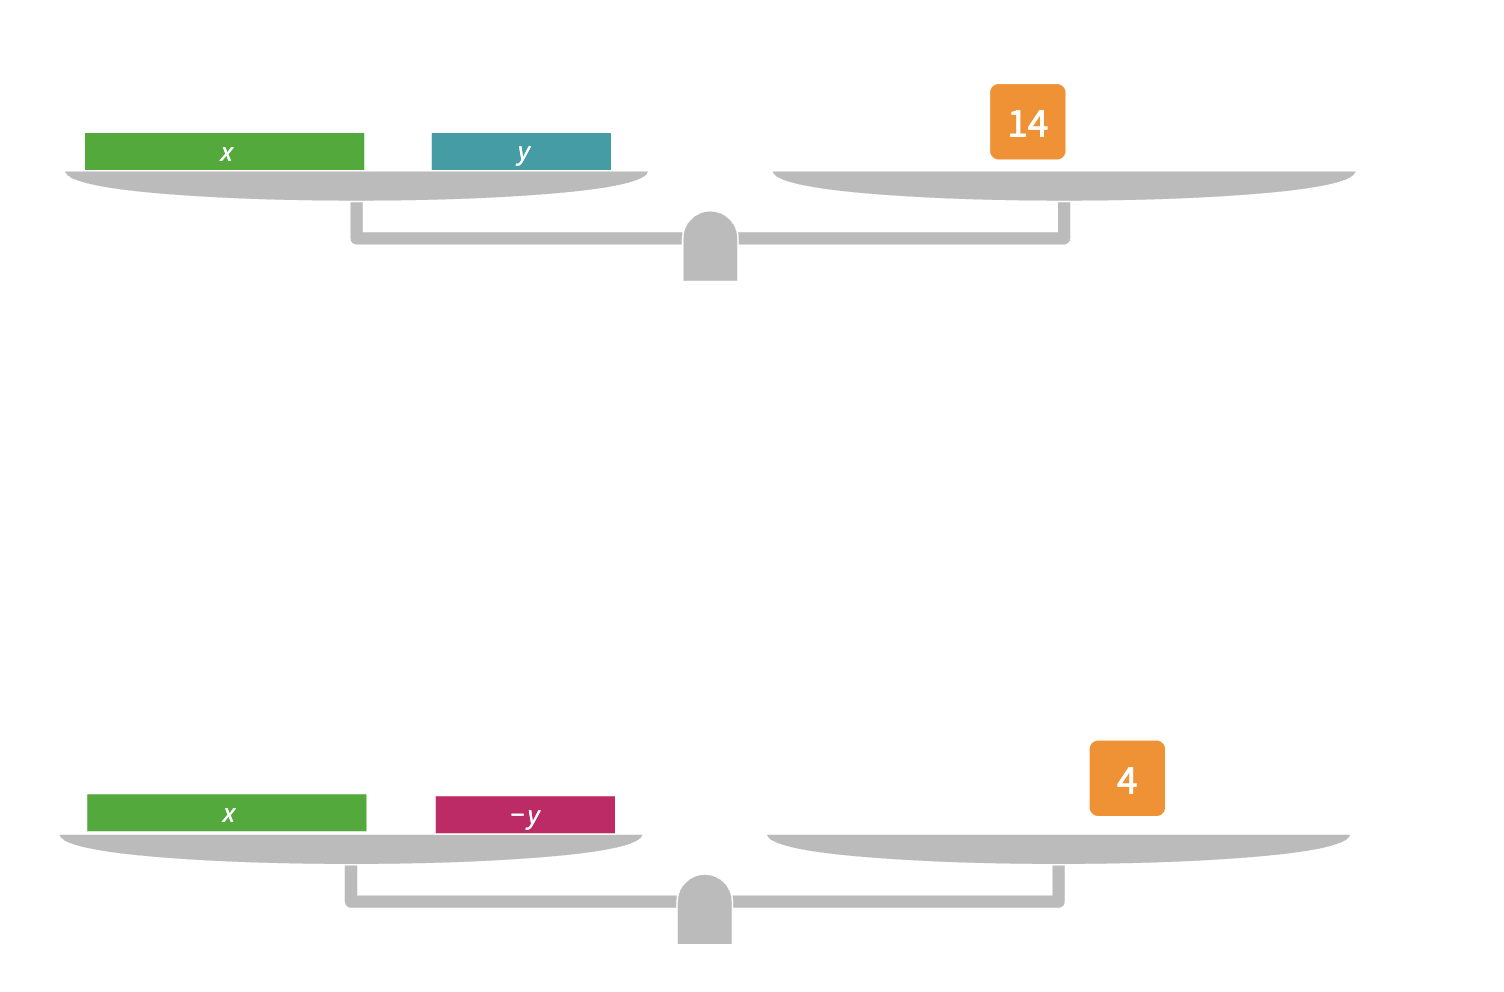
I then used Polypad to show them this linear system:
I asked them to tell me what the two equations were (i.e. x + y = 14 and x – y = 4) and then showed them how we could combine these two equations and, with the power of the zero pair, end up with a simplified equation to solve.

When students saw the y and the -y bars actually be eliminated in front of their eyes, it really did seem to help them make sense of the algebra. What I like about Polypad is that I can show something visually and then alongside it write what is happening symbolically.
The students were then given other linear systems to solve in groups at the whiteboards and we were happy with what they did. Having the students work on the vertical whiteboards allowed us to move from group to group giving feedback when necessary.

This dealt with elimination when one pair of the variables are opposite quantities (e.g. 3y and -3y). But what happens when they are the same quantities (e.g. 4x and 4x)? Well, Polypad can help us again:
Finally, what happens if the linear systems do not have variables in equal or opposite amounts (e.g. 3x + 2y = 16 and x + y = 4)? Well, Polypad allows us to visualise manipulating one of these equations to create a 'match':

When the students reviewed solving linear systems by elimination, it was pleasing to see how well they did:


My thanks go to Ms. K. Perri and her wonderful class of students.
Here are the links to the various Polypads that I have created to help teach this:
Linear Systems 2


Tuesday, May 9, 2023

Developing Some Circle Properties


Circle properties are new to the Grade 9 de-streamed math course here in Ontario. Personally, I have always enjoyed these: not just the proving of them but also solving questions where you have to deduce which properties to use.

Recently I visited a class to help students develop these properties. My approach is to do so using the concrete-diagrammatic-symbolic continuum and to encourage students to make conjectures before we formally prove a particular property. 

I start by giving every student a paper circle and a sheet with four sections for each of the properties we are going to explore. My first instruction is to fold the circle in half and I demonstrate with my own larger circle. It is worth your while making sire every student does this accurately: some will need your help. Then I simply ask: what have you just made. Most are comfortable in replying that the fold we have made is in fact the diameter. Then I tell them to fold it in half again; in doing so, most can tell me that we have now found the centre of the circle so we can now mark this on and draw the radius. I also ask them to draw the corresponding radius on the opposite side. 
The next step is to fold the circle so that the radius on one side of the circle lines up with the radius on the other side. In doing so we create a chord (which we draw on and label) that is perpendicular to the radius. 
It is worth your while to check that your students make this fold accurately and that the chord is 90˚ to the radius. Now I ask the students to think about anything that they notice and wonder. This, in essence, is a conjecture and they write this down on their sheet:
In this particular case, most of the students noticed that the radius appears to perpendicular bisect the chord and ask them to check this conjecture with a ruler. After they confirm that seems to be the case, I then ask if it will always be the case and show them this Geogebra demo:
Of course, this still doesn't prove that it works for all cases so now I prove to them why it is always true. I love showing proofs like this to students as, once they see it, it is very visual and intuitive. I also think it is so important that they get to see what a proof is and to know why something is always true (as opposed to just trusting me that it is). The key thing here is that when we add the radii to the diagram we create two right-angled triangles and from there we use the Pythagorean rule:
Once we have proved this property, we write a formal definition in the section on their sheet marked 'Theorem'.
The next property we look at is angles in a semi-circle. On their sheets I ask them to mark a point P on the circumference of the circle and to join this to the end points (A and B) of the diameter. They repeat this for a second point, Q, and again I ask them to make a conjecture:
In one class I did this, one student made a conjecture that the 'higher up the point, the larger the area of the triangle'. I had never heard this before so we spent a couple of enjoyable minutes thinking about the truth of this statement (I will leave it to the reader to prove this!).
Most students conjectured that the angles were right angles and we checked this with either protractors or the corner of a sheet of paper before I showed this Geogebra demo:

Again, this is not a proof per-se, so I then walk them through a visual proof as seen below. The key thing I emphasise here is that when you draw on radii in a circle, you can create isosceles triangles galore!
Again, after we prove this property we write this as a formal theorem on our sheet.

The next property we look at is angles in the same sector (or angles subtended from a chord). We start by marking two points, M and N, on the circumference and joining these to make a chord. Now we join points P, Q and R to the endpoints of this chord (as shown) to create three angles:
Most students made the conjecture that these angles were equal, so I gave them tracing paper to confirm that this was the case (they simply drew the angle P and placed it on angles Q and R to see that they were equal). A quick Geogebra demo also illustrates this idea:
The proof of this property follows more naturally from the last one we look at so we then write the formal theorem:
The final property we look at (angles at the circumference are half the angle at the centre of a circle) is what I used to think of as the Star Trek property! Again, we start by drawing a chord MN and joining the centre, O, to the endpoints M and N. We do this also for a point A on the circumference: for the sake of visual clarity, I suggest a point towards the top of the circle.
Not as many students were as confident about making a conjecture for this property but when some suggested that the angle at the centre was double the angle at the circumference, I asked them to check this with their tracing paper: they traced the angle at the centre, folded it in half and then checked that this was the same as angle A. Again, we illustrated this with Geogebra:
Again, we can prove this visually by making use of isosceles triangles:


Now we know this, the third property can be proved simply:
I like to finish the lesson by giving this real-life challenge: how can you find the middle of a circle if you cannot fold it. For example, hopw would you find the centre of this wooden circle if you needed to drill a whole in the centre?
Most groups simply want to estimate where the diameter might be and draw two of these to get an approximate centre, but this group used the second property to draw a diameter more accurately by putting a right angle on the circumference:
I then take this idea and show how we can draw two (or more) diameters by using property 2 and thus finding the centre of the circle:

The slides and links that I used for this lesson are part of a presentation that I recently gave at the OAME Annual Conference in Toronto and can be found here.