Monday, January 20, 2014

Making Predictions

Here in Ontario, we have had some very cold and snowy weather recently. I took advantage of this in a Grade 5 class to see if the students could make predictions using line graphs. Getting students to predict what graphs look like is, in my opinion, as important as getting students to draw graphs from given data: it gets students reasoning, proving and reflecting.
Before going further, a little geography might be in order:
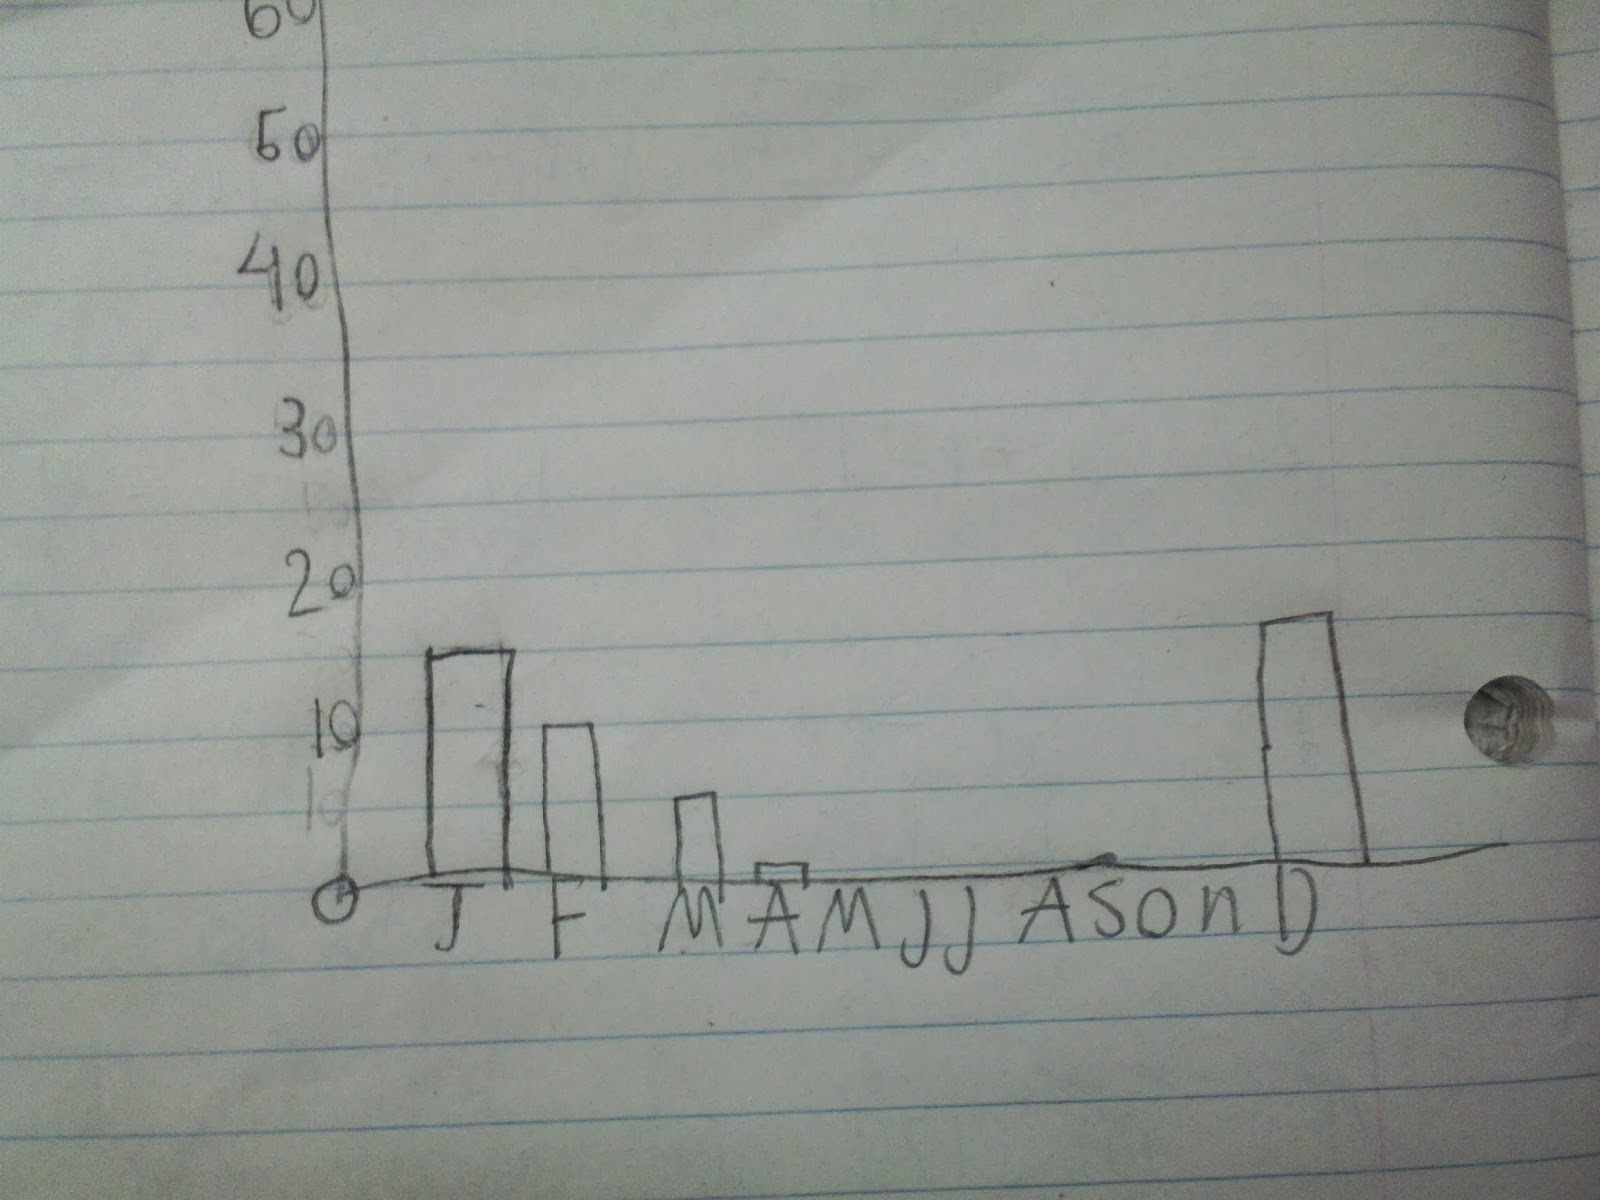
We asked students to draw a graph to predict what they thought the average snowfall per month in Toronto would be. A set of axes was drawn on the board to anchor everyone to the same scale. Initially some drew bar graphs, some vertical line graphs and some broken line graphs. As our goal was interpreting line graphs, we asked students to redraw (if necessary) their graphs so that it was a line graph. This is the sort of thing we saw:


We could then ask the students one of my favourite questions:
Look at your graphs: What is the same? What is different? 

We then showed them the actual graph from  a really neat site called CityStats.ca:

There were some great conversations about how close their graphs were to the actual graph, even though they did not have access to the primary data. Also there was great discussion about the red line, what it meant and how it looks as if Toronto gets less snow than the Canadian average.
So we then asked them to predict what the graph for Iqaluit would look like (Iqaluit, the capital of Nunavut, is in the far north of Canada). What we saw was a graph similar to Toronto's but shifted upwards:


We then showed them the CityStats graph for Iqaluit...

... and it was neat to see everyone reflect that their answer was wrong (and they were OK with that) but to then think of reasons why that might be. Superimposing the two graphs we noticed a curious thing:

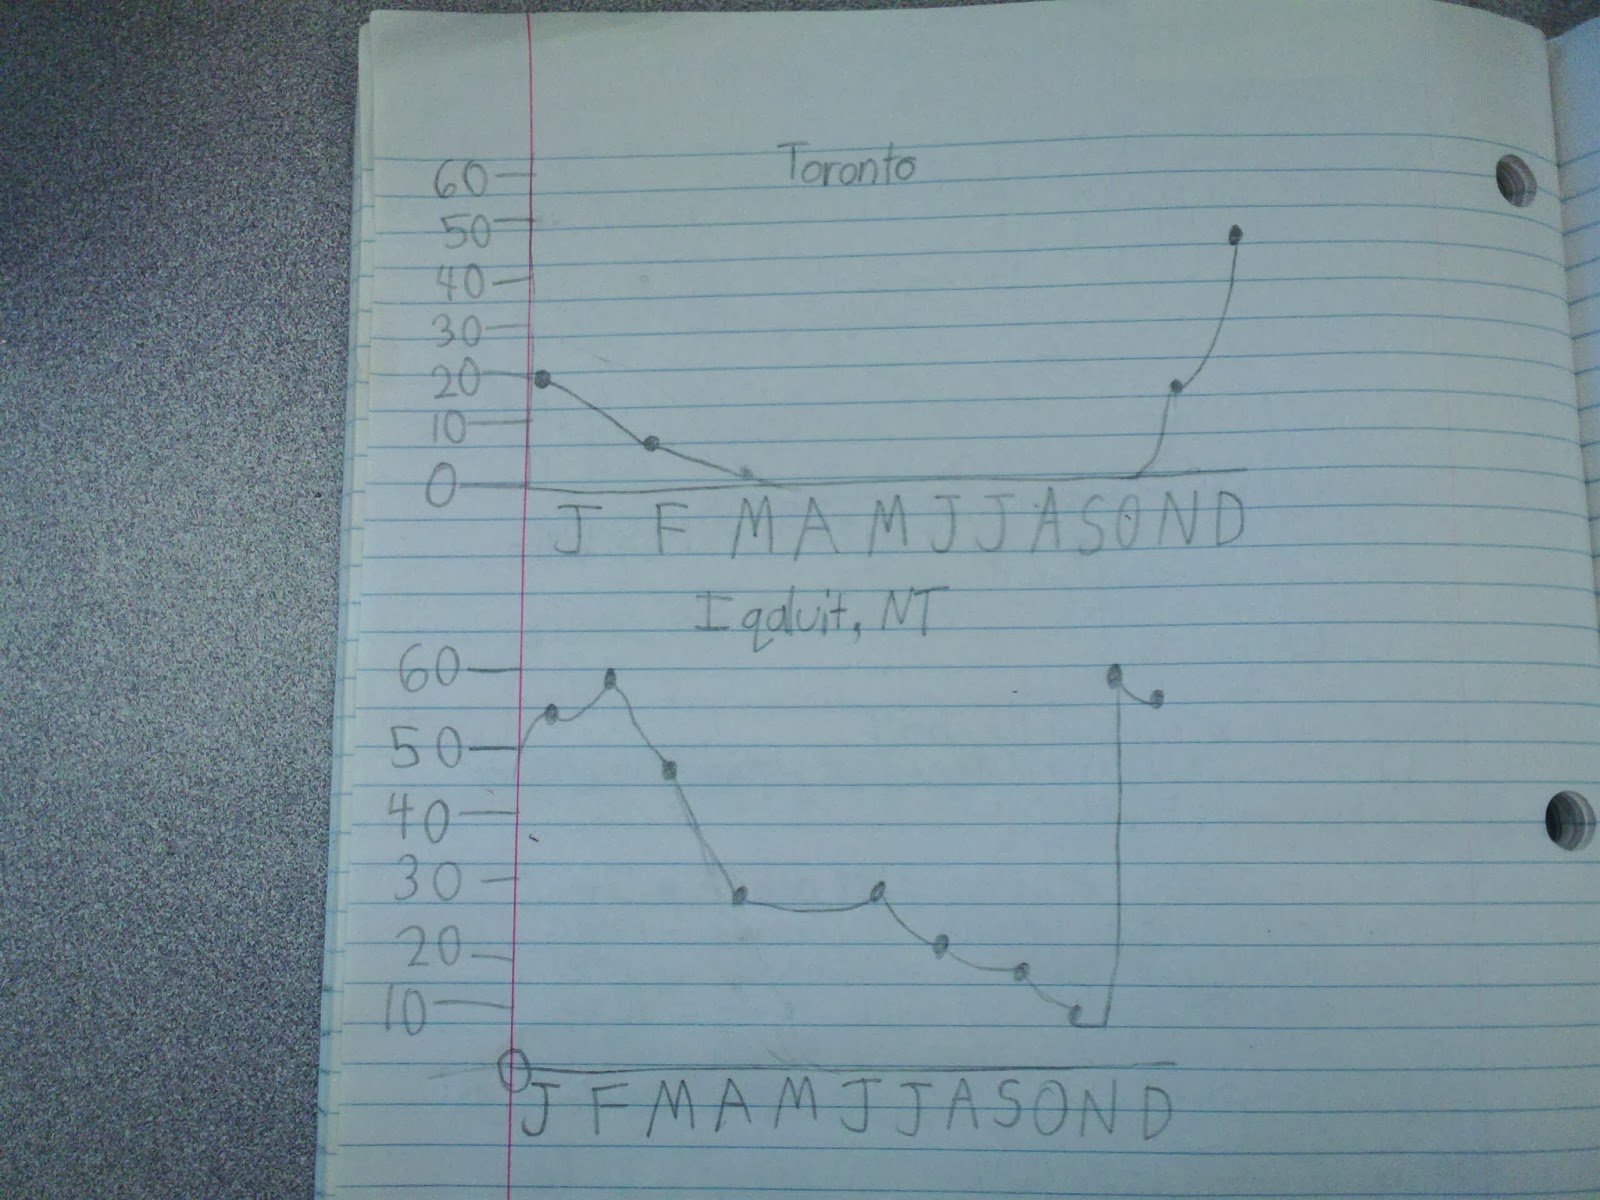
Iqaluit gets less snow than Toronto in the winter months!
This was a big surprise to all the students (and most of the adults). Various reasons were suggested as to why this might be until one girl said "Well in Science we've been learning about the water cycle and because it is so cold in Iqaluit, all the water will be frozen and so there will be not as much moisture in the air so there will be less snow". Now I'm not sure if this is the exact scientific reason, but it was a very impressive hypothesis!
And a lot better than my 'It's too cold to snow' excuse.

Thursday, January 9, 2014

Elapsed Time Problems Using an Empty Number Line

Some time ago I gave students the question:
A movie starts at 3:40 p.m. and lasts 2 and 3/4 hours. What time will it finish?
The students (who had a very algorithmic approach to addition and subtraction) produced solutions such as: 
This particular student figuring that 5:85 is not a familiar time, decided that maybe he should have subtracted instead but then ends up with an equally bewildering 0:95!

In a previous post, I showed how the empty number line is a great tool to improve students' abilities in addition and subtraction. Today it was great to see some Grade 5 students use the empty number line to solve an elapsed time problem. The question we gave was as follows:
Mr. Huxter has a problem; he has forgotten his Grade 5 math and started cooking his turkey too late. His family couldn't eat until 8:30 p.m.! The turkey took 3 and 3/4 hours to cook. If his family wanted to eat at 6:00 p.m., what time should he have started to cook the turkey?
These students were able to decompose numbers in a variety of ways so were able to get the solution in a variety of ways:
 
One student used a mental number line to solve this and wrote his strategy thus:


We followed up the question by asking "What time did Mr. Huxter put his original turkey in?" It was again interesting to see a variety of successful approaches:  

This example below, the student starts by taking 30 minutes off to get to a friendly 8:00:
This question involved finding the start time using the end time and the elapsed time. It will be interesting to see how they solve problems when they are given the start and end times and have to find the elapsed time, or when they are given the start and elapsed time and have to find the end time. I suspect that as long as they continue to use the empty number line, they will no find these problems any more difficult.
In fact, past experience tells me that the more they use the number line, the more they will be able to visualise this and thus solve these mentally.

Wednesday, December 18, 2013

What Do Angles Measure?

I've had a lot of fun asking this question both to educators and students recently. Typical replies are; "They measure degrees"; "They measure the size of the vertex/point."; "They measure the distance between the two lines."
The last reply in particular leads to the common misconception that the angle A below is larger than the angle B.
To clarify what angles measure I do a little pirouette and tell people this:
Angles measure turn.
And as with all measures, we shouldn't jump in to teaching about standard units of measuring (degrees) until the students have had experience with non-standard units (e.g. full turns, half turns, right angles etc.)
I used to show students what a right angle is by pointing to the corner of a piece of paper. Now I get them to make their own right angle by doing the simplest Origami as shown below:
A question which I'm often asked is why is a right angle 90 degrees (and not, say, 100 degrees)? Well the answer lies in how many degrees are in a full turn and there will always be some students who know this, especially if they are into skateboarding or snowboarding: 360 degrees. So why 360 degrees? Well the ancient Babylonians were the first folk to consider breaking the full turn into smaller standard parts. They knew that the Earth took 365 days to go around the Sun (long, long before Copernicus) but they also knew that 365 was not exactly a friendly number to work with. they chose 360 instead as they used a base 60 for their numbers. Good job they did otherwise we would be saying that a right angle is 91¼ degrees!
So to get students to really understand the notion that angles measure turn, I have them estimate angles using some cheap-and-cheerful angle measurers as shown:

Here I want students to actually turn the arms of the angle to create the angle. Here is a video of a student using them in a class to see if the angles in a quadrilateral are greater than or less than a right angle.

I find if they have experience estimating angles first, then when they come to measure angles with a protractor, they will not be confused by the two scales that most protractors have.
Finally, to counter the misconception that angles cannot be larger than 360 degrees I might ask students to either use the cardboard angle measurer above or to stand up and turn 180 degrees, then again, then again and ask "How many degrees have you turned now?" This idea of having angles beyond 360 degrees will be important in higher grades when they start learning about periodic functions and unit circles as this site shows.

Friday, November 29, 2013

First Steps in Developing Number Sense

One of my clearest memories of doing maths when I was 6 or 7 was in Mrs. White's class at St. Thomas More R.C. School. We used Cuisenaire rods to develop our understanding of number bonds up to ten. I'm pretty convinced that this laid the foundations for my good number sense and it is an experience I love repeating with young students from Kindergarten, Grade 1 and Grade 2. I start by asking the students to make a 'Staircase' as shown below:

Now this can be quite challenging for some students, but after this has been completed, I then get students to see that each coloured rod represents a quantity between 1 and 10. So I'll ask questions such as "Blue is what number? 5 is what colour". When the students know these they are then ready for the next step: I lay down an orange 10 red and ask:
Put two rods together that match the 10 rod.
This is my 5-year old son doing it for the first time:


When I was in Mrs. White's class, I do remember that before long, I was thinking "8+2 is 10" as I put the brown with the red. And this is what I see kids do now I try it myself with them: they are learning the facts by acting out the operation with the rods. The aim is that after a while they will not need the rods, that they will just 'see' that 7+3 is 10.

So what future knowledge will this connect to?
Well, firstly, it isn't too long before kids will see that 7+3 is the same as 3+7. In other words they will 'discover' the commutative law. I won't call it this though; I'll call it 'Dan's Rule' or 'Samantha's Rule' after whomever first notices it.
The rods also lead nicely into the idea of bar models by which we can represent the concrete (the rods) with a diagram and these in turn lead us to the abstract notation of related facts.
In fact, this development (concrete, diagrammatic, symbolic) is one which we must keep in mind when we are getting our students to develop their number sense. It will give students the opportunity to generalise their number sense into algebraic sense. If a question reads:

In Grade 3 there are 47 girls and 35 boys. How many more girls are there?

Students can represent this with a bar model and then use this to think about how this can be represented with any one of four number sentences:
In this case, some students might choose to do 47-35 but others might think 'What do I have to add to 35 to get 47'. Either way, you get 12.
And all of this thinking can begin in kindergarten with Cuisenaire rods.

Tuesday, November 19, 2013

Problems With Place Value

Place value is so much more than Base 10 blocks.
This is a common theme has emerged in a number of recent Collaborative Inquiry sessions where we focused on what students know and don't know about place value. A lot of questions from textbooks and worksheets tend be of the type shown below:
The danger with these types of questions is that I have seen students get the right answers but have no firm understanding of quantity whatsoever. They might learn a strategy such as 'The first digit goes in the first space, the second digit goes in the second space and so on...' or 'The digit on the right tells you how many little blocks, the one next to it tells you how many rods, and the one next to that tells you how many flats and so on...' If base 10 blocks are the only representation used then there is a real danger that students will develop misconceptions such as on that was highlighted by Sue Willis in First Steps in Mathematics. Grade 4 students were correctly able to identify that 4 rods and 3 smalls were 43 (below).   


However, when asked how many there would be if they were cut into individual pieces, two-thirds of Grade 4 students said “I don’t know, I would have to count them.” 
Similarly, Grade 6-7 students described a large cube as ‘the thousands cube’ but thought that if it was cut up, there would be 600 small cubes (100 each side).  This sort of error explains why some students think that 24+25 is 13 as it is simply 2+4+2+5.

With this in mind, we visited a number of classes to try some different sort of place value and quantity questions. We set out to deliberately bring out any student misconceptions by asking them to order a set of numbers such as:

547, 600 - 3 twenties, 5 tens 7 ones 4 hundreds, 5 hundreds 23 tens, 4 fifties

As the students began to order these, it quickly became clear that many were making errors based on a simplified grasp of standard partitioning. As one teacher said "Boy, we've done way too much of that...".
So in addition to the bog-standard standard partitioning questions, we realised the importance of asking questions like:
  • Write 57 in at least three different ways
  • 1000 take away 47 tens is the same as how many tens?
  • How many 20s in 100? 500? 1000?
  • How many 25s in 500? 1000?
This will give students a deeper and more flexible understanding of quantity and place value which will be necessary if they are to have good number sense.

Monday, October 21, 2013

A Mobius Twist

"Why did the chicken cross the Mobius strip? To get to the other..., hey, wait a minute..."
I came across this twist on the Mobius Strip today and it is too good not to share. It is from Martin Gardener whose birthday is today (21st October).
First, cut two strips of paper:
Then tape them in the shape of a cross:
Now tape them so that you create one Mobius strip and one normal loop: 
Now trisect the Mobius strip part and bisect the normal loop part.

But before you do, predict what will happen.
 
I and my colleagues were pleasantly surprised...
So what grade could we do this with? And how can we get it to fit the curriculum?

Thursday, October 10, 2013

How are you feeling? Average? Or just mean?

If I ask someone how they are feeling and they reply "Oh, average" it is sometimes very difficult for me not to say "Oh, and what sort of average would that be then? Mean? Median? Or mode?" For the record, I do (mostly) refrain from such a comment but it does get me thinking how misunderstood the idea of average is. For example, if I asked you to work out the average of my (ahem) Math Test marks below:
85, 81, 84, 87, 89
...I would imagine that most people would work out the mean and not the median, and I would be very surprised if anyone would work out the mode (and to be honest, why would you with this set of data?) I would also suspect that for those who work out the mean, a majority would do so by adding up the scores and then dividing by 5. With this set of data though, my first instinct is to look at the numbers and think '85 is in the middle of these, so I wonder if I can adjust the other numbers to get as close to 85 as possible?'
I could do this as follows:
Take 4 from the 89 and add it to the 81 so I now have:
85, 85, 84, 87, 85
Now I can take one from the 87 and add it to the 84 to get:
85, 85, 85, 86, 85
Now I can see the extra one on the 86 can be split nicely between the 5 scores:
85.2, 85.2, 85.2, 85.2, 85.2
So I know my mean score is 85.2 and I can do this quickly (without any need for calculations) because I know that the mean is, in effect, the levelling of the scores. This point is often not understood by students even if they have learned the 'add all the scores and divide by the number of scores' formula.
So how can we get students to think of the mean like this? Well suppose a quick survey was done on the number of siblings that six students have and we get the following data: 2, 3, 1, 4, 1, 1. We could represent this as follows:
 If we see that we have some scores above 2:
...and then level these out:
then we see that the mean number of siblings (as opposed to the number of mean siblings) is 2.
Now I'm not saying that the mean should be worked out like this every single time but I certainly believe that all students should understand that this is what the mean does.
And this is not just a notion that is helpful in elementary schools. Earlier this year I was working on a Calculus problem as part of my Masters in Mathematics teaching at the University of Waterloo. I had to find the mean width of a semi-circle with radius 1. There is a quite amazing formula (below) that can be used to find this out but I didn't need it.
 
I relied on the approach above. Knowing that the semi-circle will have an area of πr²/2 or simply π/2, I realised that to find the mean width I just had to adjust the semi-circle to a rectangle of length 2 with the same area as the semi-circle and from here find out its width.


For good problem solving questions that require students to apply their understanding of the mean, you should look at the University of Waterloo Math Contest site. The one below is from the 2013 Grade 9 Pascal contest.