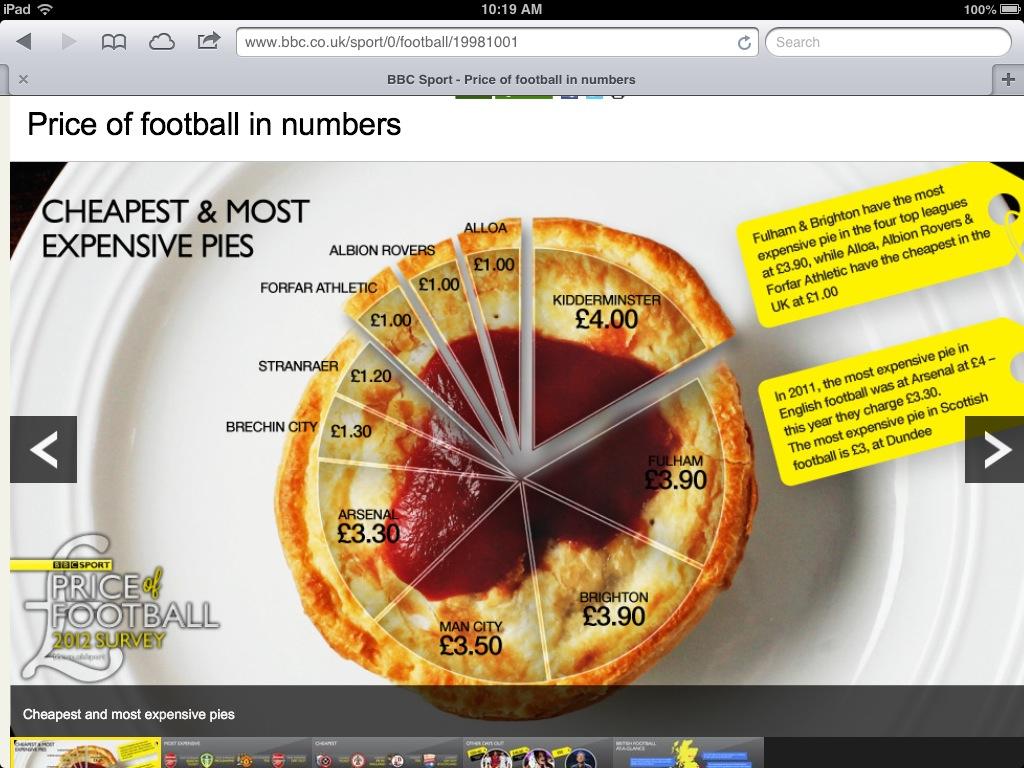
More importantly, is it possible to get Grade 5 students to understand the differences between the two?
In fact, what is the best way to get any student to learn how to handle data? Filling in blackline masters? Hand-drawing pie graphs after changing the data to percentages and then multiplying each percentage by 3.6 to get the number of degrees and then using a protractor to measure these?
To me, the ability to handle data is so much more than this. It is about:
- asking the right questions to get good data
- thinking about the most effective way of displaying the data, with your audience in mind
- interacting with the data: is it biased? Valid? What are its implications?
... and say that it makes no sense to present this data as a pie graph.
I tool part in a lesson study recently with the focus being on handling data. We were going into a Grade 5 class and the teacher was concerned that her students didn't know the difference between discrete and continuous data. What was quite telling was that as adults there was some confusion regarding this too and it took a lot of discussion with a lot of different examples before we all had some level of comfort with these terms.
Our 'Minds On' for the lesson was what does 'handling data' mean? The students were pretty good at saying that data is just information and that we need to try to make sense of this data. We used the following infographic from http://visual.ly/what-infographic-2 to sum this up:
We then got them to create a bar graph about their shoe size by using their actual shoes. We created three such graphs: one with all the students' shoes, one with just the boys' shoes and one with just the girls' shoes (below).
The students then had a great discussion as to why the boys' shoes were more 'spread out' than the girls' shoes.
Next we measured the students' heights and got them to create a living histogram. We used intervals of 10cm e.g. 110-120, 120-130 etc.
Again, we created a histogram just with the boys in and another one with just the girls in and again had great discussions as to why there were differences.
Now came the tricky bit: could we use this activity as a way of getting students to see the difference between discrete data (the shoe sizes) and continuous data (the heights)? We asked the students what was different about the 'shoe size numbers' and the 'height numbers'? A lot of conversations centred on the idea that the heights were measured but that the shoe sizes weren't. Then one student suggested that for the heights you could always find 'numbers in between' but that you couldn't do this for shoe sizes.
"Yes you can, you can have 3 and a half," shouted out one student.
"But can you have 3 and a quarter, or 3 and an eighth?" I asked. Quickly the class agreed that shoe sizes can only have certain numbers but heights could have any numbers. To emphasise this, we used a number line on Geogebra and simply kept on zooming in on the 140-150 interval. As the decimals changed from tenths to hundredths then thousandths and beyond one student said "Wow, you could go on forever doing that!"
And then another said "Yeah, it's like those numbers are continuous!"
It is very hard to suppress a huge Cheshire-Cat-smile when something like this happens!
We summarised like this:
Discrete data can only have specific values, often (but not always) just whole numbers.
Continuous data can take any value.
We ended by asking students to give their own examples:
Number of students in a class? Discrete.
Amount of pop in a bottle? Continuous.
Amount of time it takes to get to school? Continuous.
Number of siblings? Discrete.


No comments:
Post a Comment